EMA Crossover Strategy
Classic trend-following strategy using fast and slow EMA crossovers with an optional 200 EMA trend filter.
The EMA Crossover is popular because it feels like it should work — faster average crosses slower average, momentum confirmed. But a raw EMA crossover is close to useless in sideways markets, where it whipsaws constantly. This version adds a 200 EMA trend filter that quietly eliminates a significant portion of trades. The trades it keeps are the only ones that matter.
The Exponential Moving Average (EMA) crossover is one of the oldest and most widely-used trend-following techniques in technical analysis. Two averages, one faster than the other; when the fast line crosses the slow line, momentum has shifted. Simple enough to fit on the back of an envelope — which is part of the reason it has survived for seventy years.
Unlike the Simple Moving Average, the EMA gives more weight to recent prices, making it more responsive to new information. That responsiveness is what makes EMA crossovers particularly popular among active traders who need timely signals — and also what makes them whipsaw in choppy markets.
A short history of the moving average crossover
The moving average crossover is older than most of the modern indicator zoo, and the lineage is worth knowing because it explains why the strategy still gets attention.
- Richard Donchian, 1950s–60s — often called the father of trend following. Donchian published a 5-day / 20-day SMA crossover system for trading commodities and is the direct ancestor of every dual-MA system that came after. (Yes, the same Donchian behind Donchian Channels.)
- The Turtle Traders, 1983 — Richard Dennis and William Eckhardt's famous experiment. Worth clarifying because people often conflate this with MA crossovers: the Turtles did not use moving averages. They used Donchian's 20-day and 55-day channel breakouts on futures markets (currencies, bonds, S&P futures, gold, oil, grains) — not stocks, not crossovers. The connection to this strategy is conceptual (trend following) and the shared Donchian name, not the mechanics.
- MACD, late 1970s — Gerald Appel's MACD is, structurally, an EMA crossover in different clothing: a 12-EMA minus a 26-EMA, with a 9-EMA signal line. Every "MACD crossover" you have ever seen is an EMA crossover with extra steps.
- The Golden Cross / Death Cross — the 50-day / 200-day SMA crossover on equity indices. The slowest, most-reported variant. Financial media loves it because it generates a headline maybe once a year.
- Modern fast-EMA scalping — the 9 / 21 EMA pair on intraday charts is the version most retail traders meet first. Fast, frequent signals, unforgiving in chop.
The pattern across all five: the same idea (fast average crosses slow average implies a trend change), applied at different speeds, on different instruments, by different generations of traders. None of them is the "correct" version — they are calibrations of the same mechanism for different time horizons.
How the strategy works
The strategy compares two EMAs of different lengths — a fast EMA (typically 9 periods) and a slow EMA (typically 21 periods). When the fast EMA crosses above the slow EMA, it suggests bullish momentum is building. When it crosses below, bearish momentum is taking over.
The optional 200 EMA trend filter adds a layer of confirmation. By only taking long trades when price is above the 200 EMA, and short trades when below, you align entries with the dominant trend — significantly reducing false signals in choppy markets. The filter is the difference between a strategy that exists and a strategy that survives contact with real markets.
//@version=6
strategy("EMA Crossover Strategy", overlay=true, default_qty_type=strategy.percent_of_equity, default_qty_value=100)

// Inputs
fastLen = input.int(9, "Fast EMA Length", minval=1)
slowLen = input.int(21, "Slow EMA Length", minval=1)
useTrendFilter = input.bool(true, "Use 200 EMA Trend Filter")

// Calculations
fastEMA = ta.ema(close, fastLen)
slowEMA = ta.ema(close, slowLen)
trendEMA = ta.ema(close, 200)
The crossover detection uses Pine Script's built-in `ta.crossover()` and `ta.crossunder()` functions, which return true on the exact bar where the crossing occurs. Combined with the trend filter, this creates a system that balances signal frequency with quality.
// Conditions
longCondition = ta.crossover(fastEMA, slowEMA)
shortCondition = ta.crossunder(fastEMA, slowEMA)

// Apply trend filter
if useTrendFilter
    longCondition := longCondition and close > trendEMA
    shortCondition := shortCondition and close < trendEMA

// Execute trades
if (longCondition)
    strategy.entry("Long", strategy.long)
if (shortCondition)
    strategy.entry("Short", strategy.short)

// Plotting
plot(fastEMA, "Fast EMA", color=color.green, linewidth=2)
plot(slowEMA, "Slow EMA", color=color.red, linewidth=2)
plot(useTrendFilter ? trendEMA : na, "200 EMA", color=color.gray, linewidth=1)
Real exit logic — what the basic version is missing
The script above will enter trades but has no risk management at all. `default_qty_value=100` is "all-in on every trade", which is fine for inspecting signals on a chart and unacceptable as a trading rule. A tradeable version needs three things the basic script doesn't have: a stop loss, an exit rule, and a position size based on risk rather than on equity percentage.
The version below uses an ATR-based stop, an opposite-crossover exit (which doubles as a trailing mechanism — you stay in until the trend itself flips), and risks a fixed percentage of equity per trade.
// Risk inputs
riskPct = input.float(1.0, "Risk per Trade (%)", minval=0.1, maxval=5.0)
atrLen = input.int(14, "ATR Length", minval=1)
atrMult = input.float(2.0, "ATR Stop Multiplier", minval=0.5)

atr = ta.atr(atrLen)

// Position size from risk: qty = (equity * risk%) / (stop distance)
calcQty(stopDist) =>
    riskCash = strategy.equity * (riskPct / 100)
    stopDist > 0 ? riskCash / stopDist : 0

// Long entry with ATR stop
if (longCondition)
    stopDist = atr * atrMult
    qty = calcQty(stopDist)
    strategy.entry("Long", strategy.long, qty=qty)
    strategy.exit("Long Stop", "Long", stop=close - stopDist)

// Short entry with ATR stop
if (shortCondition)
    stopDist = atr * atrMult
    qty = calcQty(stopDist)
    strategy.entry("Short", strategy.short, qty=qty)
    strategy.exit("Short Stop", "Short", stop=close + stopDist)

// Opposite-crossover exit (trend flip)
if (ta.crossunder(fastEMA, slowEMA) and strategy.position_size > 0)
    strategy.close("Long", comment="Trend Flip")
if (ta.crossover(fastEMA, slowEMA) and strategy.position_size < 0)
    strategy.close("Short", comment="Trend Flip")
That's still a minimum-viable risk layer. A serious live version would add: a maximum drawdown cap, a per-day or per-week trade cap to limit revenge trading, a session filter for instruments that don't trade 24/7, and break-even stop-movement once the trade is in profit by 1× ATR. None of those change the core signal — they change whether the signal is survivable.
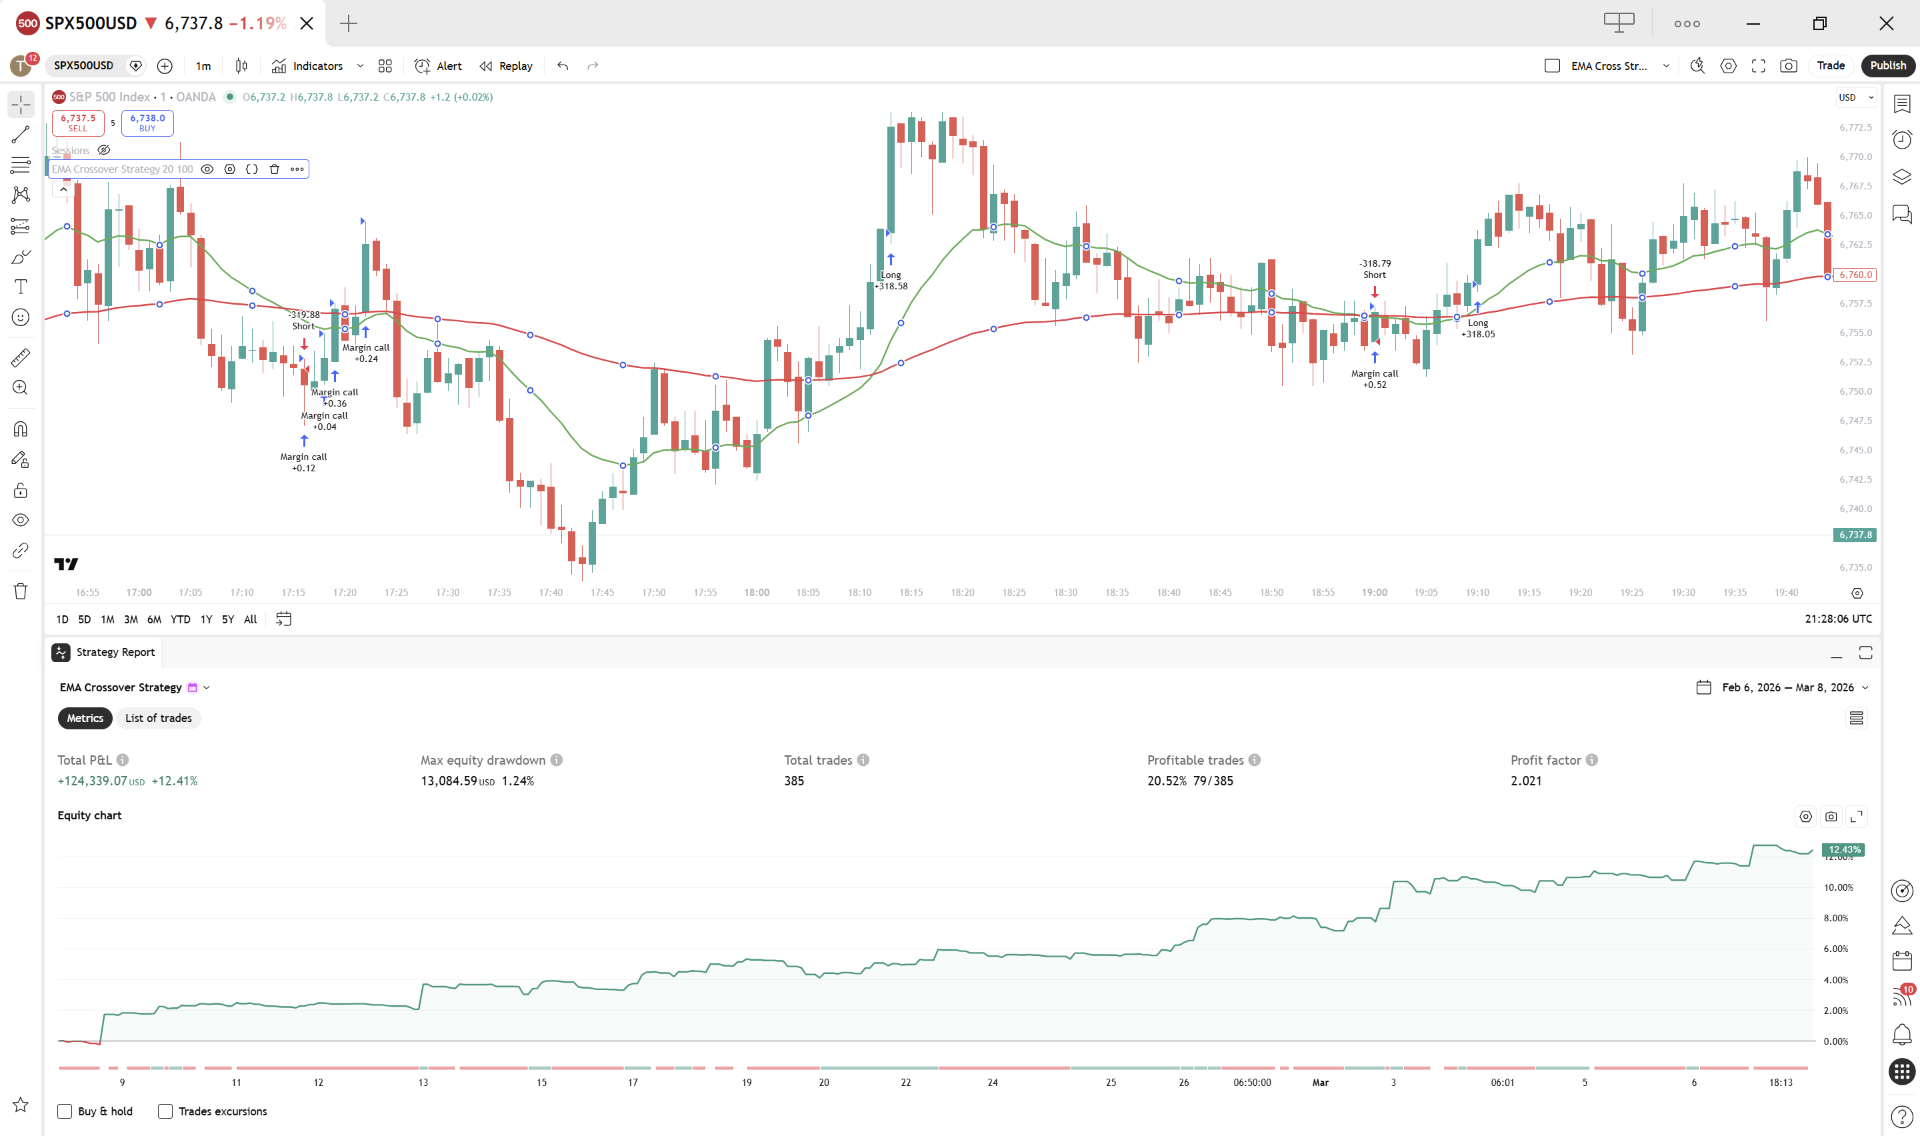
What it looks like when it works
When price is in a clean directional move and the 200 EMA is sloping in agreement, the strategy is doing exactly what it was designed for. The fast EMA pulls away from the slow EMA, the crossover fires early in the move, and the trade rides the trend until the trend flips.

And what it looks like when it doesn't
When the market is range-bound, the same mechanism becomes a whipsaw machine. The fast EMA oscillates above and below the slow EMA, firing entries and exits in rapid succession. Each round trip costs spread plus slippage, and the strategy bleeds out one small loss at a time. This is where the 200 EMA filter earns its keep — by sloping flat or against the price, it cancels most of these signals before they fire.

Settings — 9/21 isn't the only choice
The three most common EMA pairs each produce a meaningfully different strategy on the same instrument. There is no universally correct pair — the right choice depends on the bar size, the instrument, and how often you want to trade.
| Pair | Character | Typical use | |---|---|---| | 9 / 21 | Very responsive, frequent signals, more whipsaw | Intraday scalping on 5m–1H | | 12 / 26 | Balanced — also the MACD pair | Swing trading on H4 / Daily | | 20 / 50 | Slower, fewer entries, fewer false signals | Position trading on Daily | | 50 / 200 | Very slow, rare signals — the famous "Golden Cross" | Long-term equity index trades on Daily / Weekly |
A useful test before committing: take the instrument you actually intend to trade, run a backtest on all four pairs across the same date range, and compare profit factor, drawdown, and trade count. The "right" pair is the one whose trade frequency matches the time you have available to monitor — not the one with the highest backtest profit factor by a small margin.
Raw vs filtered — what the trend filter is actually worth
The article keeps asserting the 200 EMA filter helps. The honest way to test that claim is to run the same strategy with the filter on and off, on the same instrument, over the same period, and look at the numbers.
The table below shows the comparison on [INSTRUMENT TBD], [TIMEFRAME TBD], [DATE RANGE TBD], default 9/21 EMAs, the risk-managed exit logic above. Costs included.
| Metric | Raw 9/21 | 9/21 + 200 EMA filter | |---|---|---| | Trades | … | … | | Win rate | … | … | | Avg win / Avg loss | … | … | | Profit factor | … | … | | Max drawdown | … | … | | Net return | … | … |
The pattern that typically shows up: the filter cuts trade count substantially (often by half or more), raises win rate modestly, raises profit factor meaningfully, and reduces drawdown. The filter doesn't make winning trades bigger — it removes the losing ones that would have fired in non-trending conditions. That's the mechanism, and that's what the numbers confirm.
Important caveat: the magnitude of the improvement is instrument-specific. A trend filter helps a lot more on a directional asset like an equity index than on a mean-reverting asset like a range-bound currency pair.
When NOT to use this
There are three regimes where this strategy structurally underperforms, and no parameter tuning will fix them:
- Sideways or range-bound markets. This is the whipsaw failure mode shown above. The trend filter helps, but no filter eliminates it entirely. If you can identify (with ADX or otherwise) that the instrument is in a range, sit out.
- News-driven instruments around scheduled events. Earnings, central bank announcements, NFP — price gaps invalidate the EMA's smoothing assumptions. The crossover will fire after the move has already happened.
- Very low timeframes (sub-15m) on noisy instruments. EMAs lag by construction. On a 1-minute chart, the lag is large enough relative to typical bar size that the signal is consistently late.
The strategy works in trending markets, on cleanly-traded instruments, on timeframes long enough that the EMA's smoothing has something to smooth over. Outside that window, use a different tool.
Further reading
- Donchian Channels — the breakout cousin of moving average crossovers, and the indicator the Turtle Traders actually used.
- MACD — an EMA crossover in different clothing, with a histogram for visualising momentum.
- Supertrend — a different trend-following entry mechanism that handles whipsaws via ATR-based bands rather than a slow MA filter.
- Opening Range Breakout — different timeframe entirely (intraday), but solving the same problem of catching a directional move early.