SMA (Simple Moving Average)
The arithmetic average of closing prices over a set period, giving equal weight to every bar. The 50 and 200 SMAs are the most universally watched trend levels in trading.
The Simple Moving Average is the arithmetic mean of the last N closing prices — each bar gets exactly equal weight. A 20 SMA adds up the last 20 closes and divides by 20, then does that again on every bar. Because every bar is equally weighted, the SMA is smoother than an EMA of the same length but slower to respond to recent price changes.
The 50 SMA and 200 SMA are the most universally referenced trend indicators across all asset classes and timeframes. Institutional participants, retail traders, and algorithmic systems all watch the same levels — which is part of what makes them self-reinforcing support and resistance.
How traders use it
### 200 SMA as a regime filter The 200 SMA is the primary long-term trend filter in strategy building. Price above the 200 SMA = bull regime, take longs. Price below = bear regime, take shorts or stay flat. It is slower than the 200 EMA, which means it generates fewer crossover false signals in choppy conditions — a feature, not a bug.
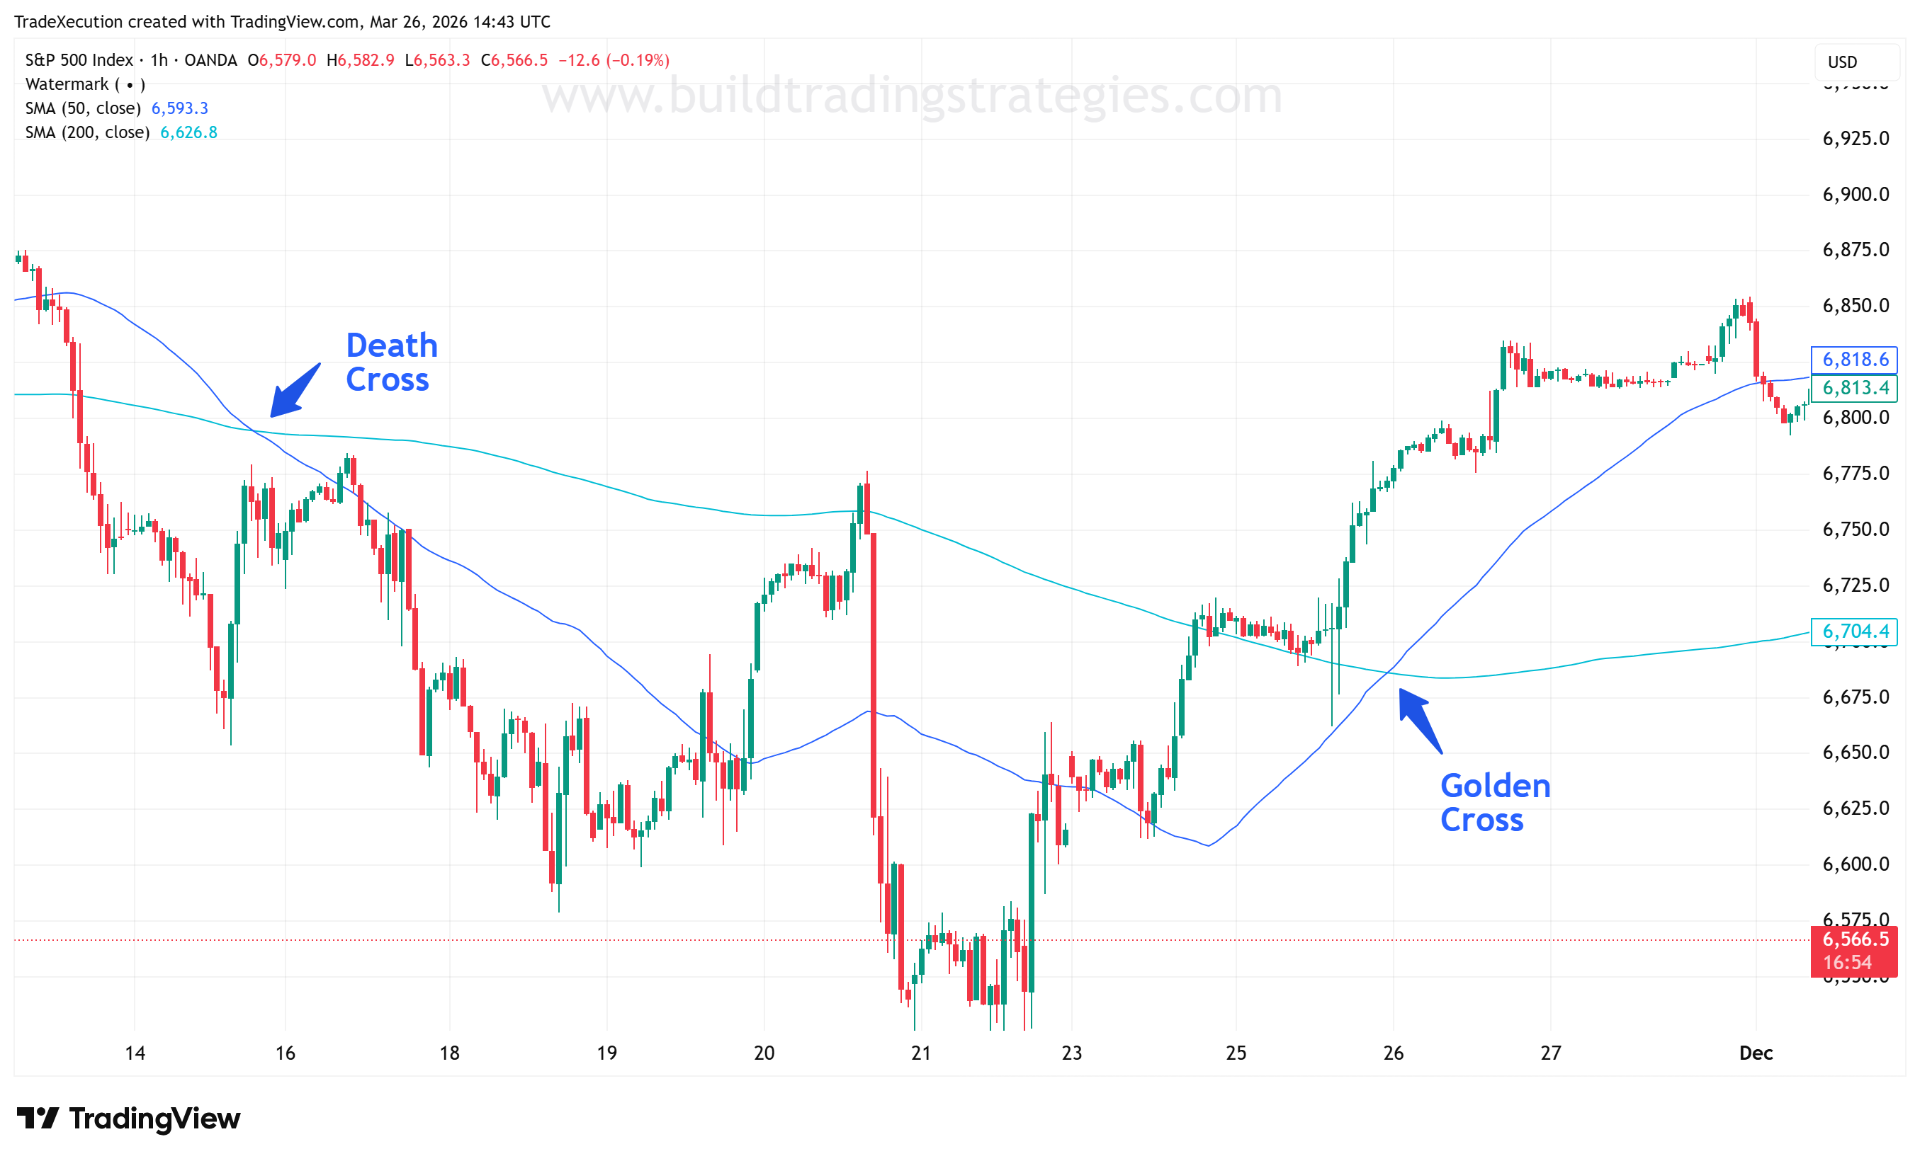
### Golden Cross and Death Cross When the 50 SMA crosses above the 200 SMA it is called a Golden Cross — a widely followed long-term bullish signal. When the 50 SMA crosses below the 200 SMA it is a Death Cross — a long-term bearish signal. These are slow signals but they appear on every major financial news outlet, which means they influence institutional positioning.
### 20 SMA as a short-term reference The 20 SMA (roughly one calendar month of daily bars) is frequently used as the basis for Bollinger Bands® and as a short-term trend level for pullback entries.
//@version=6
indicator("SMA Demo", overlay=true)

sma20  = ta.sma(close, 20)
sma50  = ta.sma(close, 50)
sma200 = ta.sma(close, 200)

// Classic macro signals
goldenCross = ta.crossover(sma50, sma200)
deathCross  = ta.crossunder(sma50, sma200)

// Regime: price above/below 200 SMA
inUptrend = close > sma200

plot(sma20,  color=color.blue,   linewidth=1, title="SMA 20")
plot(sma50,  color=color.orange, linewidth=2, title="SMA 50")
plot(sma200, color=color.gray,   linewidth=2, title="SMA 200")

plotshape(goldenCross, title="Golden Cross", style=shape.labelup,
          location=location.belowbar, color=color.green,
          text="GC", textcolor=color.white, size=size.small)
plotshape(deathCross, title="Death Cross", style=shape.labeldown,
          location=location.abovebar, color=color.red,
          text="DC", textcolor=color.white, size=size.small)

bgcolor(inUptrend ? color.new(color.green, 96) : color.new(color.red, 96))
Key takeaway: The 200 SMA is slower than the 200 EMA, which makes it more stable as a regime filter — price needs to move decisively to cross it and stay there. For long-term trend filtering, many systematic traders prefer the 200 SMA over the 200 EMA precisely because it is harder to break, reducing whipsaw entries in volatile but directionless conditions.