Bollinger Bands®
A volatility-based indicator consisting of a middle SMA band and upper/lower bands at a set number of standard deviations.
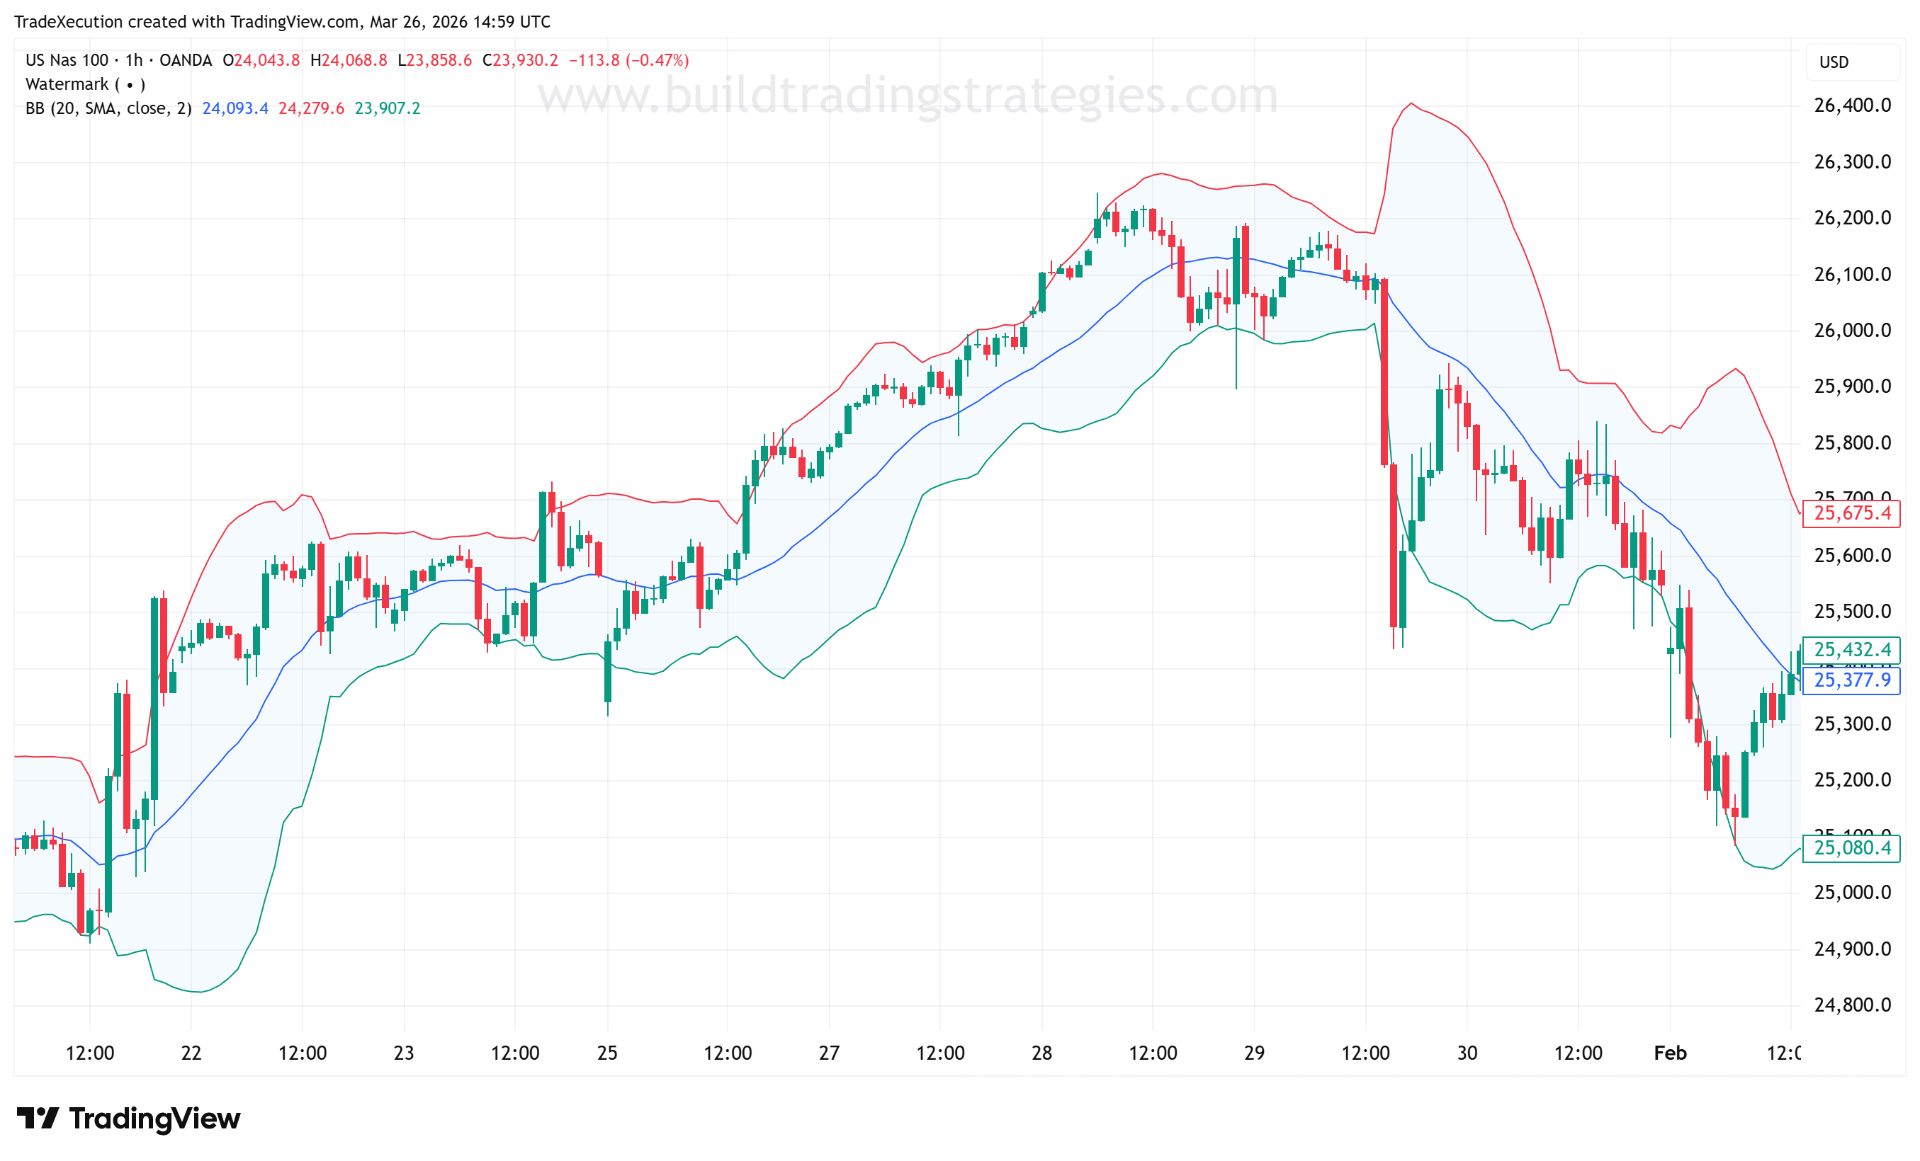
Bollinger Bands® were created by John Bollinger in the 1980s and published in his 2001 book Bollinger on Bollinger Bands. The original design uses a 20-period Simple Moving Average as the middle band (the "basis"), with upper and lower bands placed 2 standard deviations above and below it. Standard deviation is calculated over the same lookback as the MA, so the bands are always measuring volatility relative to the same window of price history the MA uses.
When volatility expands — fast directional moves, news events, breakouts — the standard deviation rises and the bands widen. When volatility contracts — slow consolidation, low-volume drift — the standard deviation falls and the bands squeeze together. That squeeze is the core signal: a tight Bollinger Band is not a neutral state, it is a coiled state. Markets that compress tend to expand again, often sharply.
There are two primary ways traders use the bands:
- Mean-reversion: Price touches or pierces the outer band, then reverts toward the basis. The SMA basis is the gravitational centre; price has a statistical tendency to return to it after deviating by 2 standard deviations.
- Trend continuation: In a strong trend, price "walks the band" — it repeatedly tests the upper (or lower) band without reverting. The band touch is not a reversal signal here; it confirms momentum. Distinguishing the two regimes is the hard part, which is why Bollinger Bands® work best alongside a trend filter or momentum indicator such as RSI.
Choosing a basis moving average
TradingView's built-in Bollinger Bands indicator now exposes the basis MA type as a user-selectable input, offering five options: SMA, EMA, SMMA (RMA), WMA, and VWMA. The choice of basis changes how quickly the midline reacts to price changes, which in turn changes both the shape of the bands and the quality of the mean-reversion signal.
SMA — Simple Moving Average (default)
The SMA gives equal weight to every bar in the lookback window. It is the slowest to react to recent price changes among the five options, which makes it the smoothest basis. Because John Bollinger designed the indicator around the SMA, backtests and published research almost always assume this setting. The SMA basis is the most stable reference point for mean-reversion logic: price deviating to the upper band and then returning to the SMA represents a textbook reversion to an unweighted statistical average.
Best for: Mean-reversion strategies, historical comparability, any market where you want the midline to act as a stable anchor.
EMA — Exponential Moving Average
The EMA applies exponentially decreasing weights to older bars, making recent price action more influential. Compared to the SMA, the EMA basis tracks price more closely — it rises faster in uptrends and falls faster in downtrends. This has two practical consequences: the bands are narrower on average during smooth trending moves (because the basis is keeping pace with price), and the bands are quicker to widen when a move accelerates.
With an EMA basis, band touches are more significant because the basis has already adjusted toward recent price. A touch of the upper band with an EMA basis represents a larger deviation from recent momentum than the same touch against a SMA basis.
Best for: Trend-following overlays, faster-moving instruments, reducing lag in the midline signal.
SMMA (RMA) — Smoothed Moving Average
The Smoothed Moving Average — also called the Running Moving Average (RMA) in Pine Script — applies a very gradual decay to older bars. It is even slower to react than the SMA. The SMMA basis produces the widest, most stable bands of any option because the midline barely moves; price has to deviate further before the standard deviation picks up the move as significant.
This makes the SMMA basis well-suited to higher-timeframe or higher-noise markets where you want to filter out brief excursions and only flag genuinely extended conditions. The downside is lag: the basis will continue tracking the old trend well after price has reversed, which can produce misleading signals on shorter timeframes.
Best for: Higher-timeframe filtering, low-noise environments, identifying only the most extreme deviations.
WMA — Weighted Moving Average
The WMA applies linearly increasing weights — the most recent bar receives the highest weight, the oldest receives the lowest, with a straight-line gradient in between. This makes it faster than the SMA but not as aggressively weighted toward recent bars as the EMA. The WMA sits between the SMA and EMA in terms of responsiveness.
A WMA basis produces bands that track price somewhat more closely than an SMA but without the EMA's tendency to overshoot during sharp reversals. Traders who find the SMA too sluggish but the EMA too reactive often find the WMA a useful middle ground.
Best for: A balanced compromise between responsiveness and stability; useful when EMA bands feel too tight.
VWMA — Volume Weighted Moving Average
The VWMA weights each bar's price by its volume, so high-volume bars contribute more to the average than low-volume bars. The VWMA basis moves toward the prices where the most trading activity has occurred. In sessions where a major directional move happens on heavy volume, the VWMA basis will shift meaningfully toward that move; during low-volume drift in the opposite direction, it barely moves.
This makes the VWMA basis particularly useful for instruments and timeframes where volume is meaningful and variable — intraday equity index or individual stock charts, for example. A band touch where the VWMA basis is also aligned with the directional move (confirming that high-volume activity supports the trend) carries more weight than a band touch that occurs against the volume-weighted trend. Note that VWMA is not meaningful on instruments or aggregations where volume data is unreliable or absent.
Best for: Volume-sensitive instruments (equities, index futures), intraday charts, confirming that band touches align with institutional activity.
//@version=6
indicator(shorttitle="BB", title="Bollinger Bands", overlay=true, timeframe="", timeframe_gaps=true)

TT_LENGTH  = "The time period to be used in calculating the MA which creates the base for the Upper and Lower Bands."
TT_MA_TYPE = "Determines the type of Moving Average that is applied to the basis plot line."
TT_SOURCE  = "Determines what data from each bar will be used in calculations."
TT_MULT    = "The number of Standard Deviations away from the MA that the Upper and Lower Bands should be."
TT_OFFSET  = "Changing this number will move the Bollinger Bands either Forwards or Backwards relative to the current market."

length = input.int(20,       "Length", minval = 1, tooltip = TT_LENGTH)
maType = input.string("SMA", "Basis MA Type", options = ["SMA", "EMA", "SMMA (RMA)", "WMA", "VWMA"], tooltip = TT_MA_TYPE)
src    = input(close,        "Source", tooltip = TT_SOURCE)
mult   = input.float(2.0,    "StdDev", minval = 0.001, maxval = 50, tooltip = TT_MULT)
offset = input.int(0,        "Offset", minval = -500,  maxval = 500, tooltip = TT_OFFSET, display = display.none)

// Resolve the selected MA type for the basis line
ma(source, length, _type) =>
    switch _type
        "SMA"        => ta.sma(source, length)   // Equal weight — stable, original Bollinger design
        "EMA"        => ta.ema(source, length)   // Exponential decay — faster, tracks trends closely
        "SMMA (RMA)" => ta.rma(source, length)   // Smoothed/Running MA — slowest, widest bands
        "WMA"        => ta.wma(source, length)   // Linear weights — balanced between SMA and EMA
        "VWMA"       => ta.vwma(source, length)  // Volume-weighted — reflects where activity occurred

basis = ma(src, length, maType)
dev   = mult * ta.stdev(src, length)
upper = basis + dev
lower = basis - dev

plot(basis, "Basis", color=#2962FF, offset = offset)
p1 = plot(upper, "Upper", color=#F23645, offset = offset)
p2 = plot(lower, "Lower", color=#089981, offset = offset)
fill(p1, p2, title = "Background", color=color.rgb(33, 150, 243, 95))
Key takeaway: The SMA basis remains the standard for mean-reversion logic because it is the most stable reference point and matches the original Bollinger design. Switching to an EMA basis makes the bands more responsive and better suited to trend-following overlays. SMMA (RMA) is the slowest option, useful for filtering only the most extreme conditions. WMA sits between SMA and EMA for traders who want moderate responsiveness. VWMA introduces volume weighting — a meaningful edge on intraday equity charts, but only where reliable volume data exists. When in doubt, start with the SMA, then test the EMA if you find the midline lags too much for your strategy's timeframe.
Bollinger Bands vs ATR — two volatility tools
Bollinger Bands and ATR both measure volatility but in different forms, and they pair naturally:
- Bollinger Bands use the standard deviation of closes over N bars — a statistical measure of how much price has dispersed around its mean. The bands form a visible envelope on the chart, and the output is directly comparable to current price (is price at the upper band? lower?). Best for entry context: where is the current move in its statistical range?
- ATR uses the true range of each bar (max of H−L, H−prevClose, prevClose−L). The output is a single number in price units, designed to size stops and targets. Best for exit and sizing: how far is a realistic stop given current volatility?
A common pairing is to use Bollinger Bands to identify the entry (mean-reversion bounce from the lower band; breakout of the upper band), and ATR to place the stop (2× ATR below entry for longs). That way both sides of the trade scale with current volatility rather than fighting against it.