RSI (Relative Strength Index)
A momentum oscillator that measures the speed and magnitude of recent price changes on a scale from 0 to 100, used for overbought/oversold analysis, momentum confirmation, divergence spotting, and pullback entries.
RSI is a momentum oscillator that measures the speed and magnitude of recent price changes on a scale from 0 to 100. The classic version is RSI(14), with 70 commonly treated as overbought and 30 as oversold. In practice, traders use RSI for far more than simple 70/30 signals. It is also widely used to assess momentum around the 50 centerline, spot bullish and bearish divergences, and time pullbacks within an existing trend.
//@version=6
indicator("RSI Demo", overlay=false)

rsiLength = input.int(14, "RSI Length", minval=1)
rsi       = ta.rsi(close, rsiLength)

// RSI(2) — much shorter period, useful for timing short-term pullbacks
rsi2 = ta.rsi(close, 2)

plot(rsi,  "RSI(14)", color=color.purple,              linewidth=2)
plot(rsi2, "RSI(2)",  color=color.new(color.blue, 30), linewidth=1)

hline(70, "Overbought", color=color.red,   linestyle=hline.style_dashed)
hline(50, "Midline",    color=color.gray,  linestyle=hline.style_dotted)
hline(30, "Oversold",   color=color.green, linestyle=hline.style_dashed)

bgcolor(rsi > 70 ? color.new(color.red, 90) : rsi < 30 ? color.new(color.green, 90) : na)

plotshape(ta.crossover(rsi, 30),  style=shape.triangleup,   location=location.bottom, color=color.green, size=size.small)
plotshape(ta.crossunder(rsi, 70), style=shape.triangledown, location=location.top,    color=color.red,   size=size.small)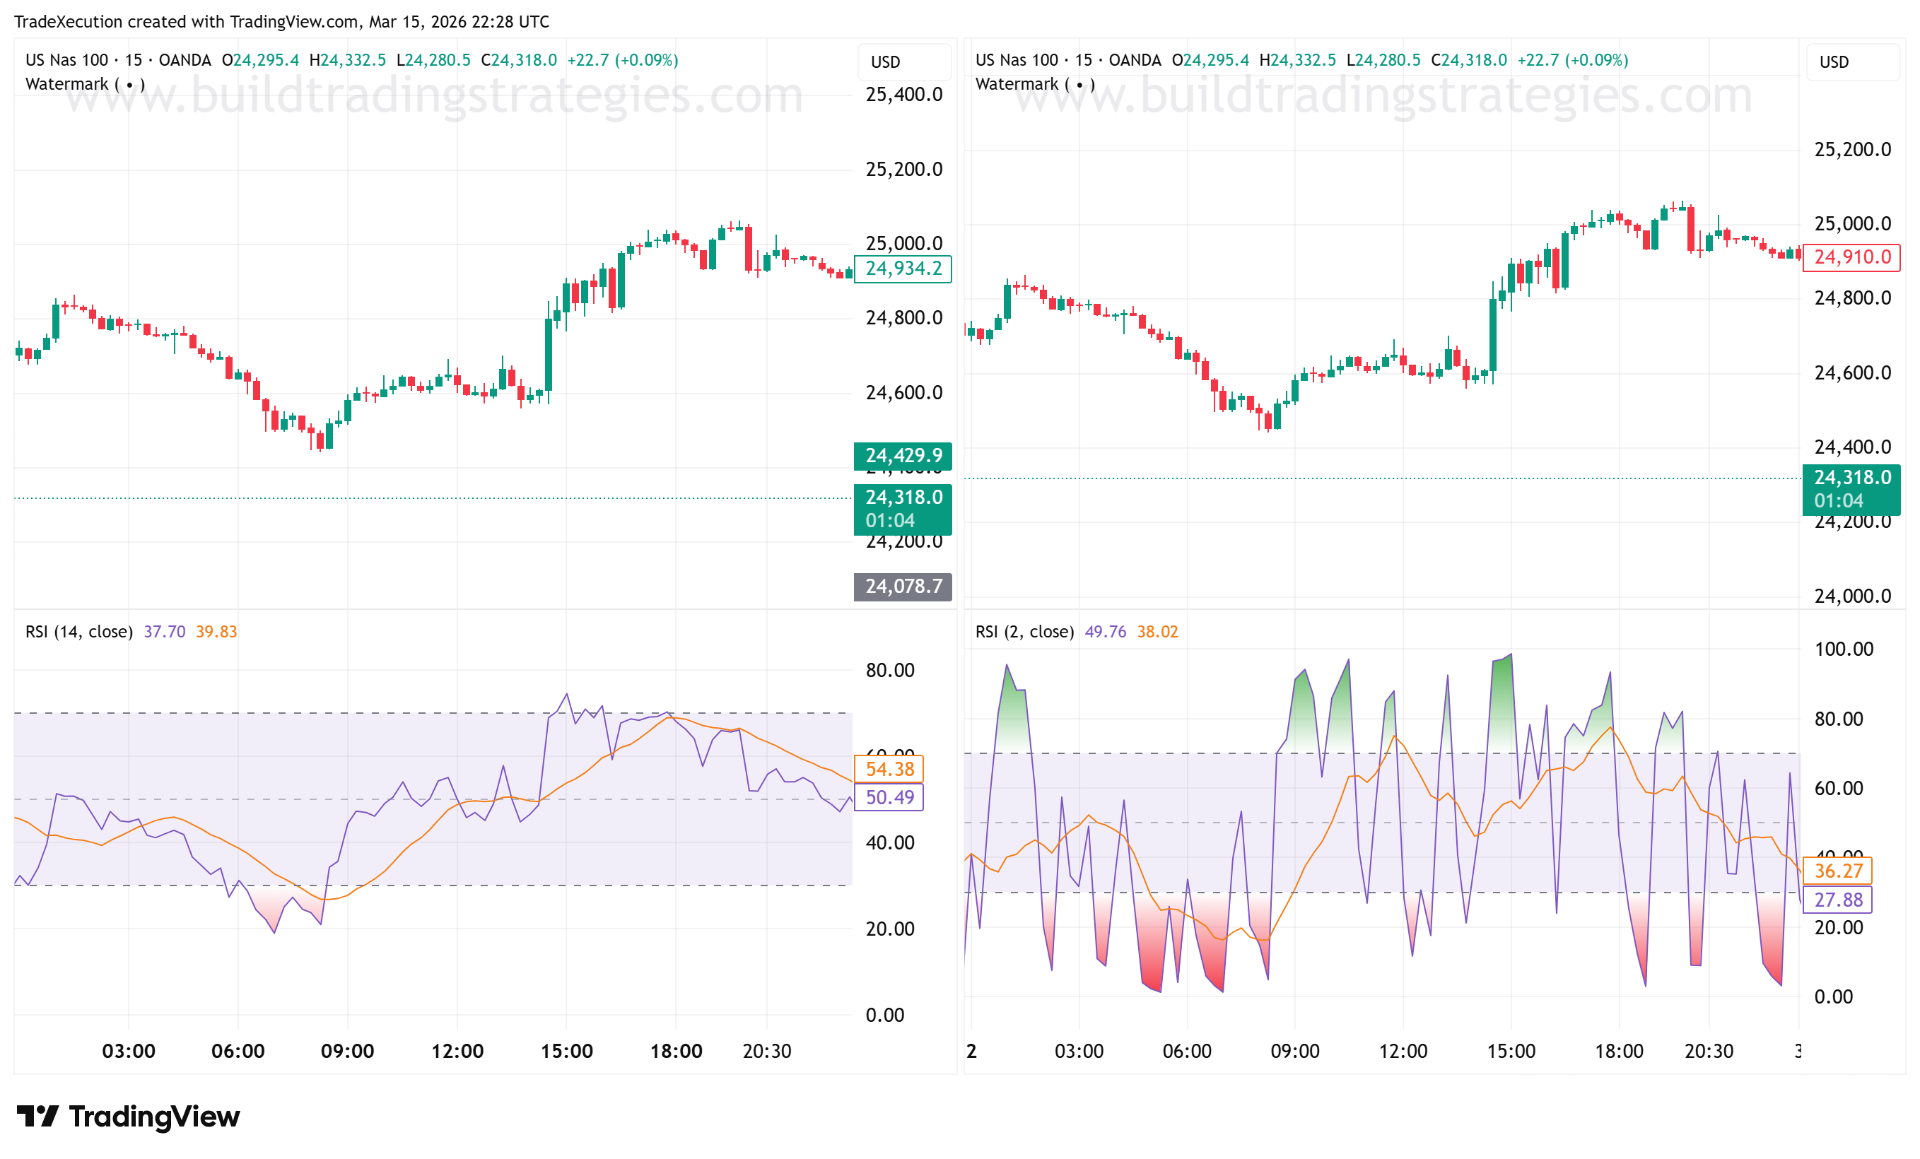
How traders commonly use RSI
1. Overbought and oversold
The classic RSI interpretation is simple: readings above 70 suggest price may be stretched to the upside, while readings below 30 suggest price may be stretched to the downside.
2. Centerline momentum
Many traders use the 50 level as a momentum filter. Above 50, bullish momentum tends to dominate. Below 50, bearish momentum tends to dominate.
3. Divergence
Traders often compare RSI to price action. If price makes a new high but RSI does not, or price makes a new low but RSI does not, that can be a warning that momentum is weakening.
4. Pullbacks in trends
Shorter RSI settings such as RSI(2) are often used to find brief pullbacks in an existing trend rather than to predict major reversals.
Key takeaway: RSI is not just an "overbought/oversold" tool. It is a flexible momentum indicator that can support both mean-reversion and trend-following strategies depending on how you use it.