ADX (Average Directional Index)
A trend-strength indicator that measures how strong or weak a trend is, regardless of direction. Useful as a strategy filter.
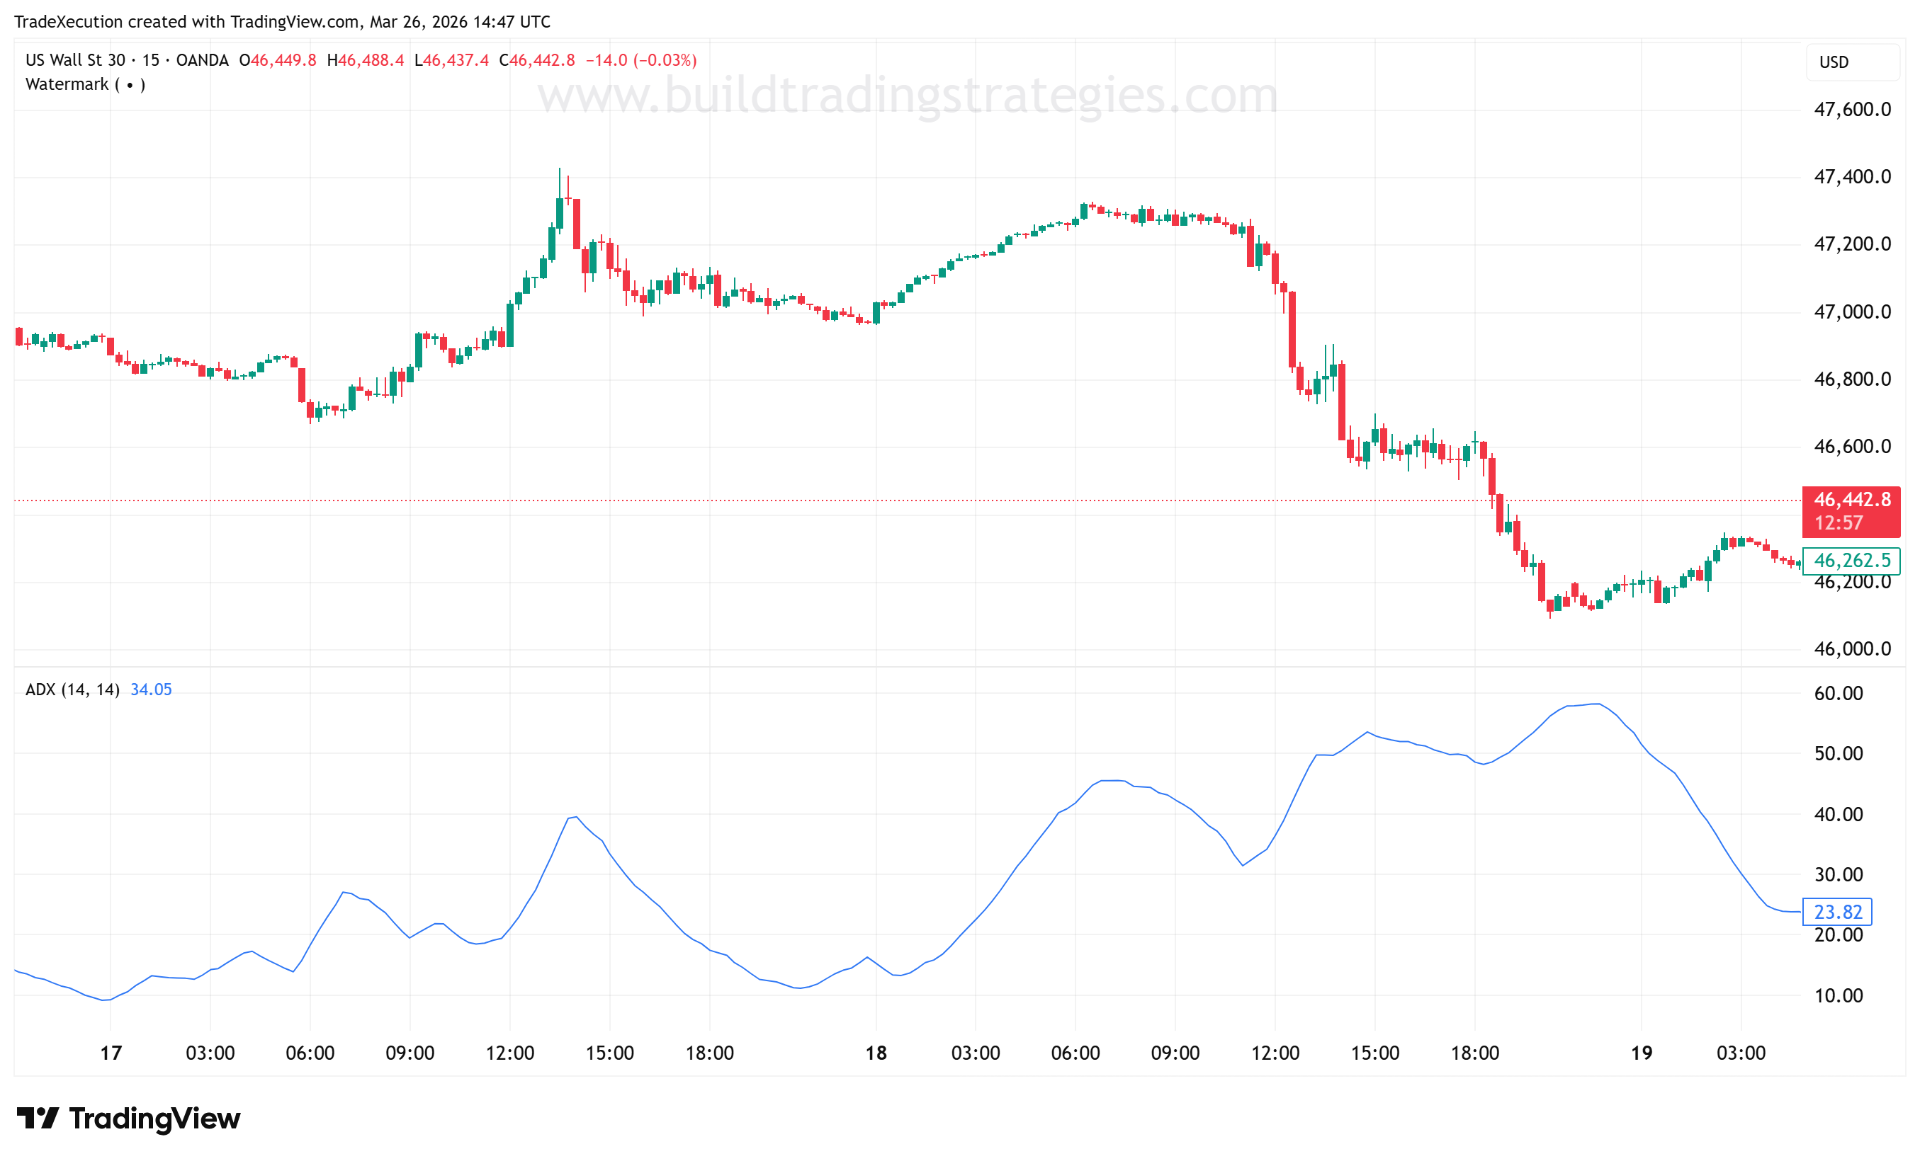
ADX is different from most trend indicators because it does not tell you direction; it tells you whether a trend is strong enough to matter. It was introduced by J. Welles Wilder in 1978 in New Concepts in Technical Trading Systems — the same book that introduced RSI, ATR, and Parabolic SAR. A commonly used setting is 14 periods. Readings below roughly 20 often indicate a weak or range-bound market, while readings above 25 suggest a stronger trend; some educational references also highlight 40+ as very strong.
That makes ADX an excellent strategy filter. A breakout strategy usually performs better when volatility is expanding and directional strength is present, so an ADX filter can help avoid taking breakouts in dead markets. Likewise, a mean-reversion strategy may work better when ADX is low and price is oscillating rather than trending. In practice, ADX is often more useful as a "should I even use this strategy here?" tool than as an entry signal.
How ADX is built: +DI, −DI, and the ADX line
ADX is usually plotted alongside two companion lines, +DI (positive Directional Indicator) and −DI (negative Directional Indicator). Together, the three lines are often called the Directional Movement Index (DMI).
The construction, simplified:
- ```
- For each bar, compute directional movement:
- +DM = high − prev_high (if positive and greater than the down-move; else 0)
- −DM = prev_low − low (if positive and greater than the up-move; else 0)
- Smooth +DM, −DM and True Range over N periods (Wilder's smoothing)
- +DI = 100 × smoothed(+DM) / smoothed(TR)
- −DI = 100 × smoothed(−DM) / smoothed(TR)
- DX = 100 × |+DI − −DI| / (+DI + −DI)
- ADX = Wilder-smoothed DX over N periods
- ```
Interpretation: +DI and −DI tell you which side is in control (+DI above −DI ⇒ uptrend bias). ADX tells you how strong that control is, regardless of direction. A rising ADX with +DI above −DI is a strengthening uptrend; a rising ADX with −DI above +DI is a strengthening downtrend; a falling ADX in any configuration is a weakening or ranging market.
One common gotcha: ADX takes time to settle
ADX uses Wilder smoothing on smoothed inputs, so it needs roughly 2N bars before its values stabilise. On a newly loaded chart, the first ~20–30 bars will show artificially low ADX readings regardless of market condition. If you are building a strategy that gates on ADX > 25, add a warm-up guard — e.g. `bar_index >= 30` — before acting on ADX signals, or the first window of each backtest will silently skip legitimate trades.