Opening Range Breakout
Captures initial session volatility by trading breakouts from the first N minutes' high/low range.
The opening range concentrates the session's first burst of volatility into a defined high and low. When price breaks out of that range with conviction, the move can extend significantly. When it fakes out, it reverses quickly. This strategy defines the range over the first N minutes, enters on a confirmed breakout in either direction, and exits with defined risk and reward. The settings — range duration, targets, session filters — are where the real work happens.
The Opening Range Breakout (ORB) is one of the most well-known intraday trading strategies, popularized by traders like Toby Crabel in his 1990 book Day Trading with Short Term Price Patterns and Opening Range Breakout. The concept is elegantly simple: the first portion of a trading session often sets the tone for the rest of the day.
The "opening range" is defined as the high and low established during the first N minutes of the session — typically 15, 30, or 60 minutes. Once this range is established, the strategy watches for price to break above the high (bullish) or below the low (bearish) and enters a trade in that direction.
The logic behind ORB is rooted in market microstructure. The opening of a trading session is when overnight orders, institutional flows, and news reactions converge. This creates a burst of activity that often establishes key support and resistance levels for the day. A breakout from this range suggests that one side (buyers or sellers) has gained control.
The strategy includes take-profit and stop-loss levels based on the opening range size, expressed as multipliers. For example, a TP multiplier of 1.5x means the profit target is 1.5 times the height of the opening range. This provides a systematic risk/reward framework.
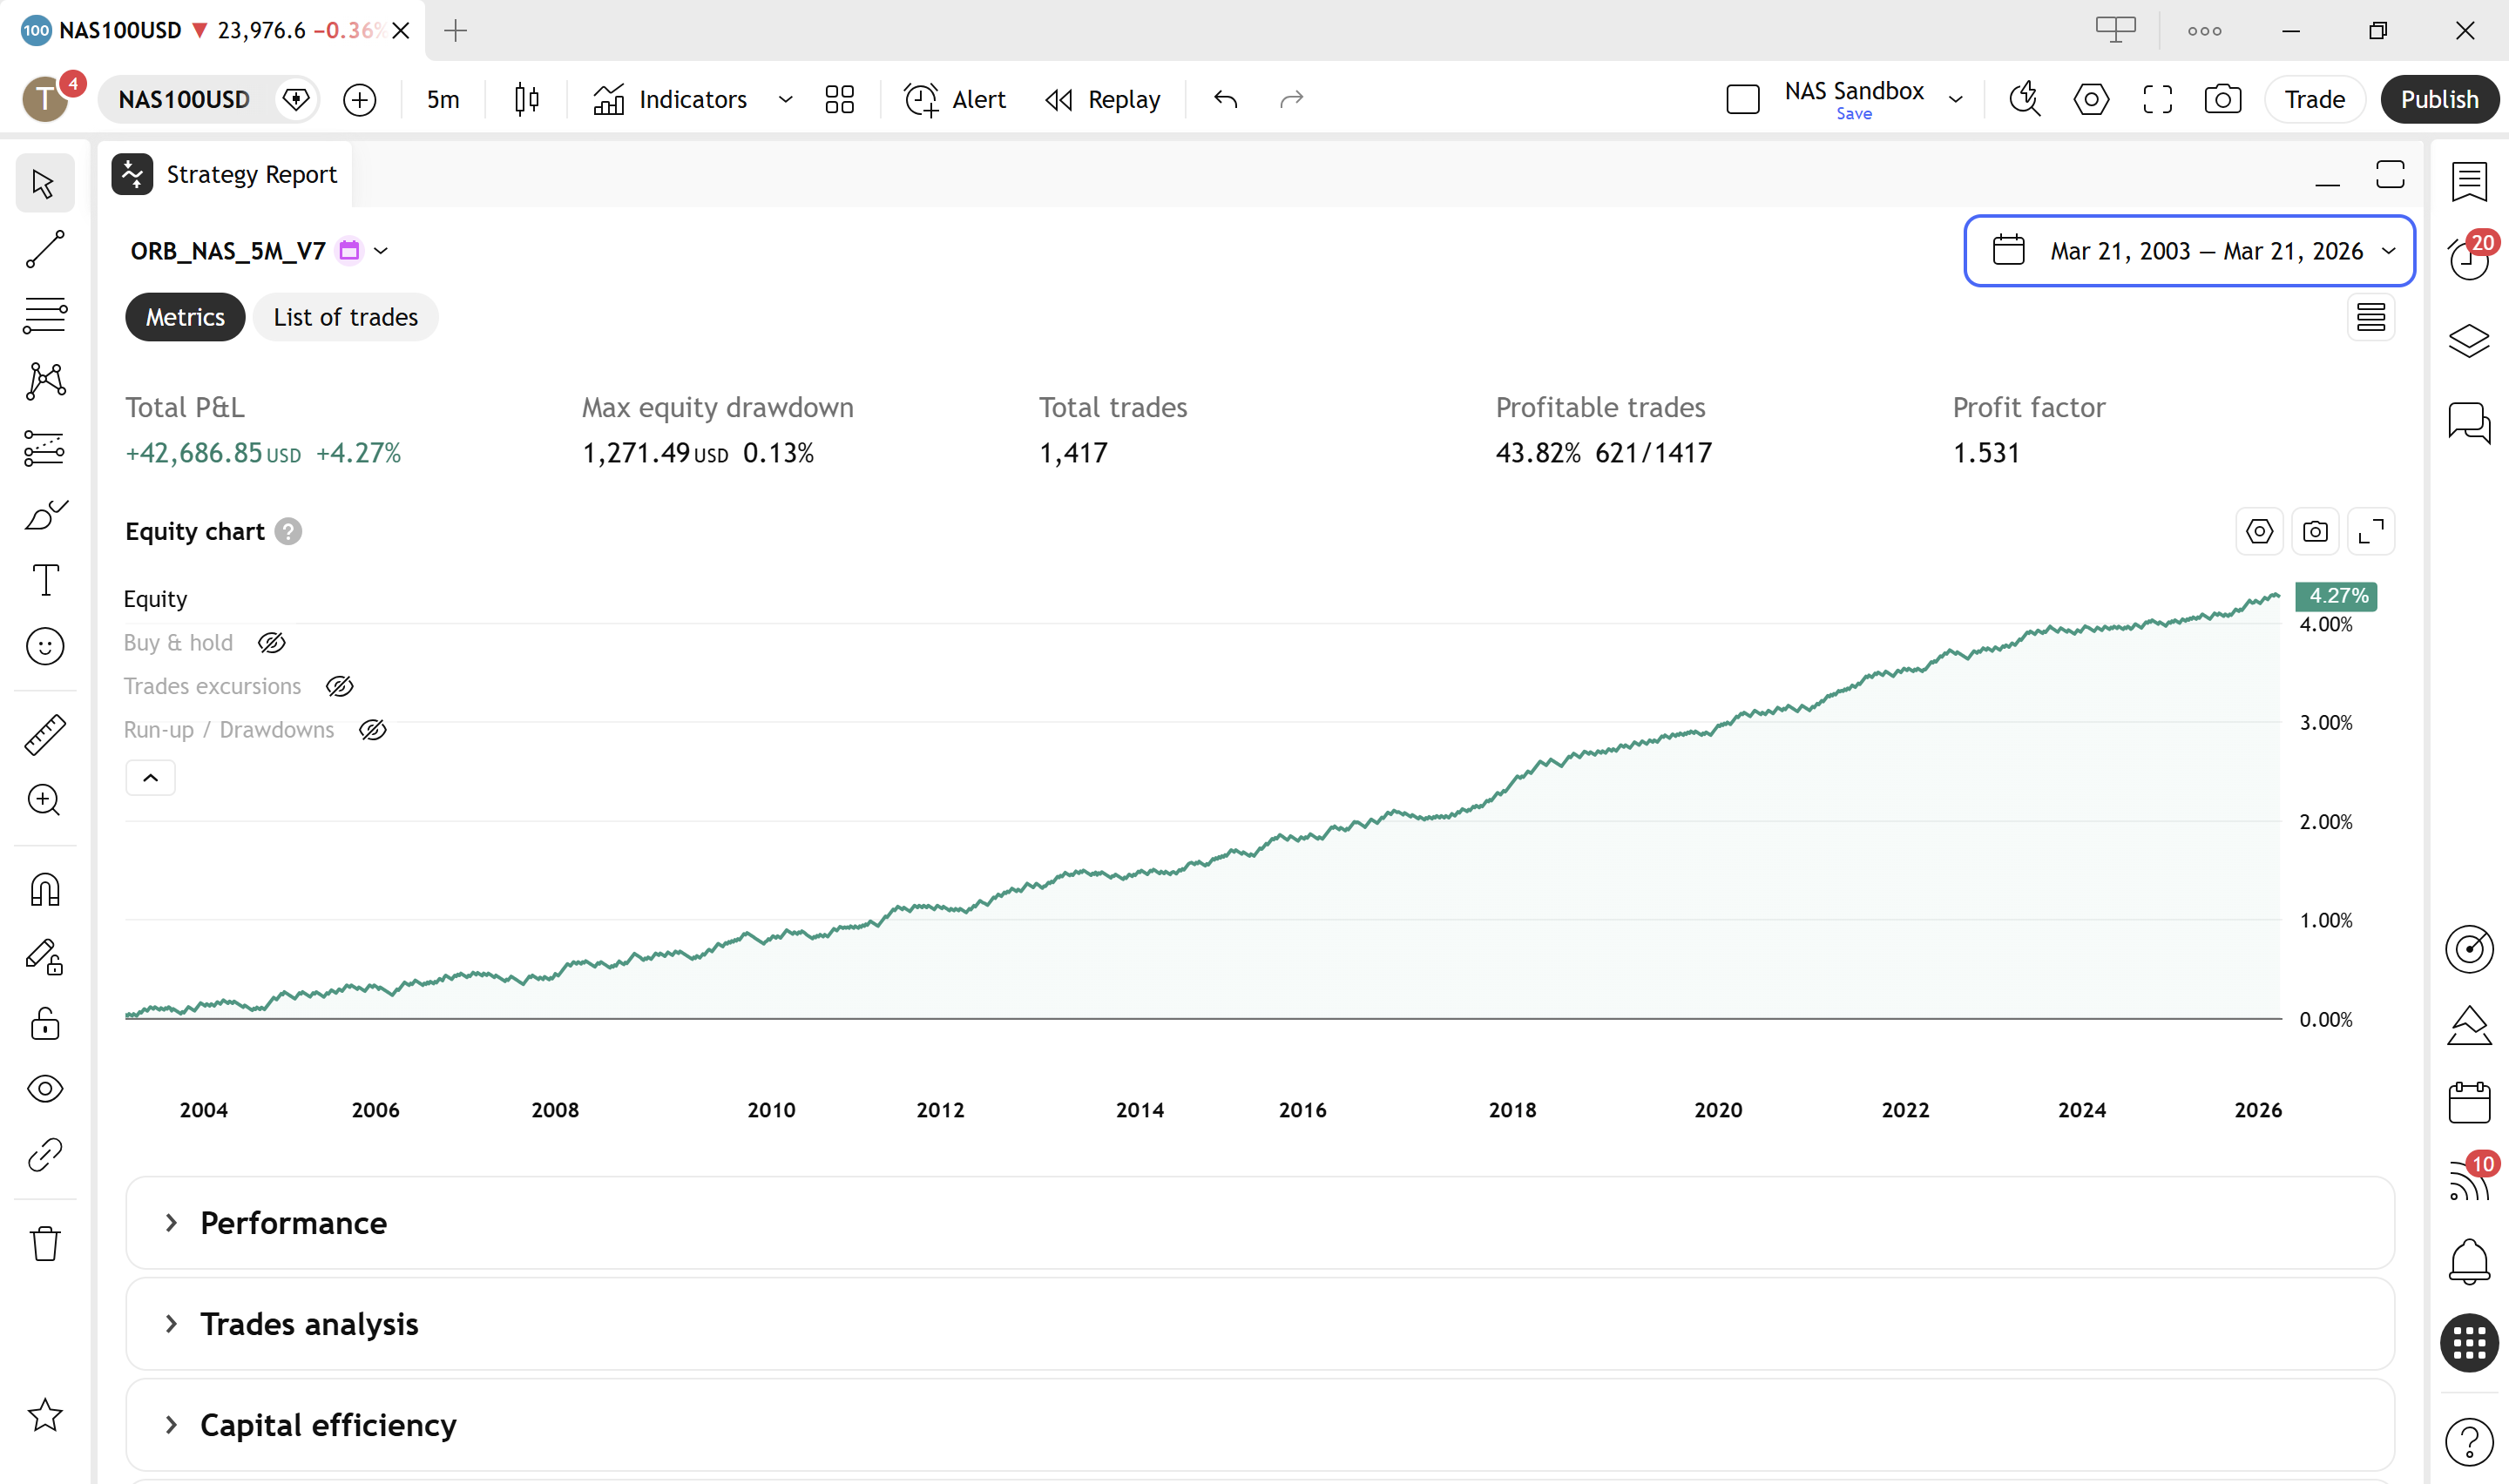
Curious how this performs over 23 years on a real instrument? This article covers the concept. The Anatomy of a 5-Minute ORB Trading Strategy walks through the complete build — 1,417 trades on OANDA NAS100USD, 22 of 23 years profitable, 0.13% max drawdown. Every filter decision, every rejected idea, full Pine Script for all twelve versions. The chart examples below are taken directly from the book.
What an ORB actually looks like on a chart
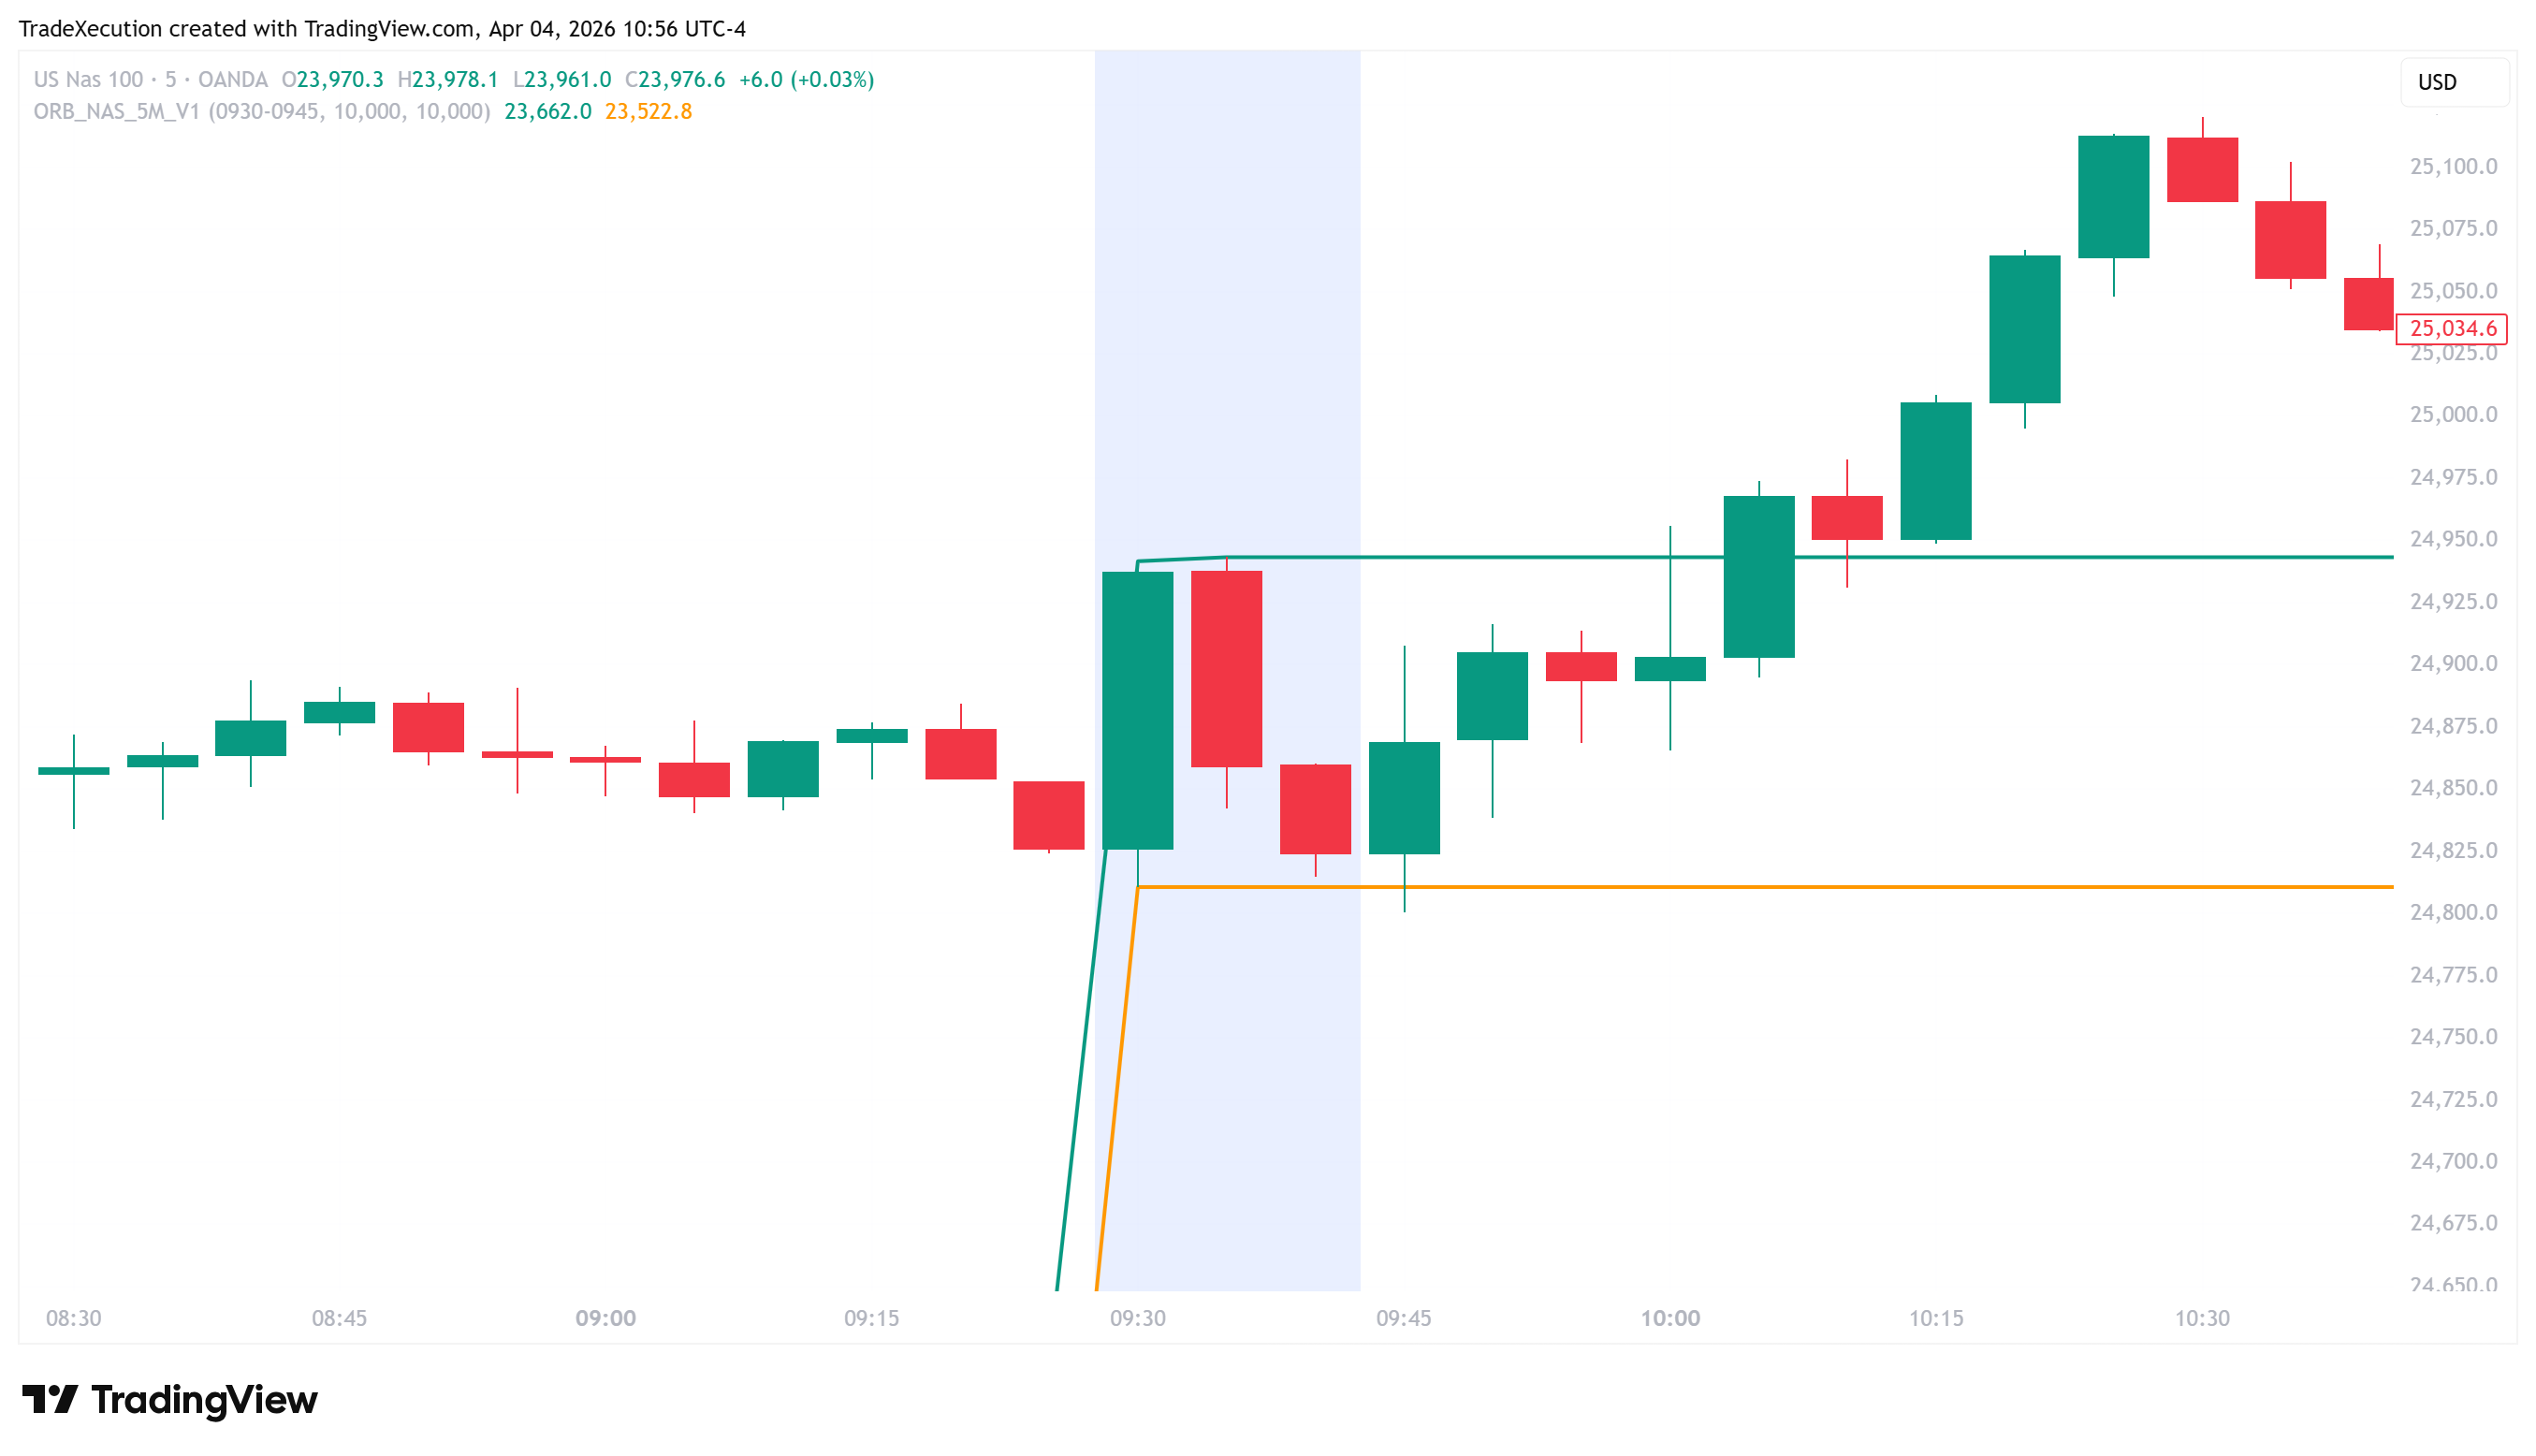
The concept is simple. Seeing it on a real chart makes it click. Here is the opening range forming in real time on the NAS100 — a zoomed view of the first 15 minutes after the US cash open:
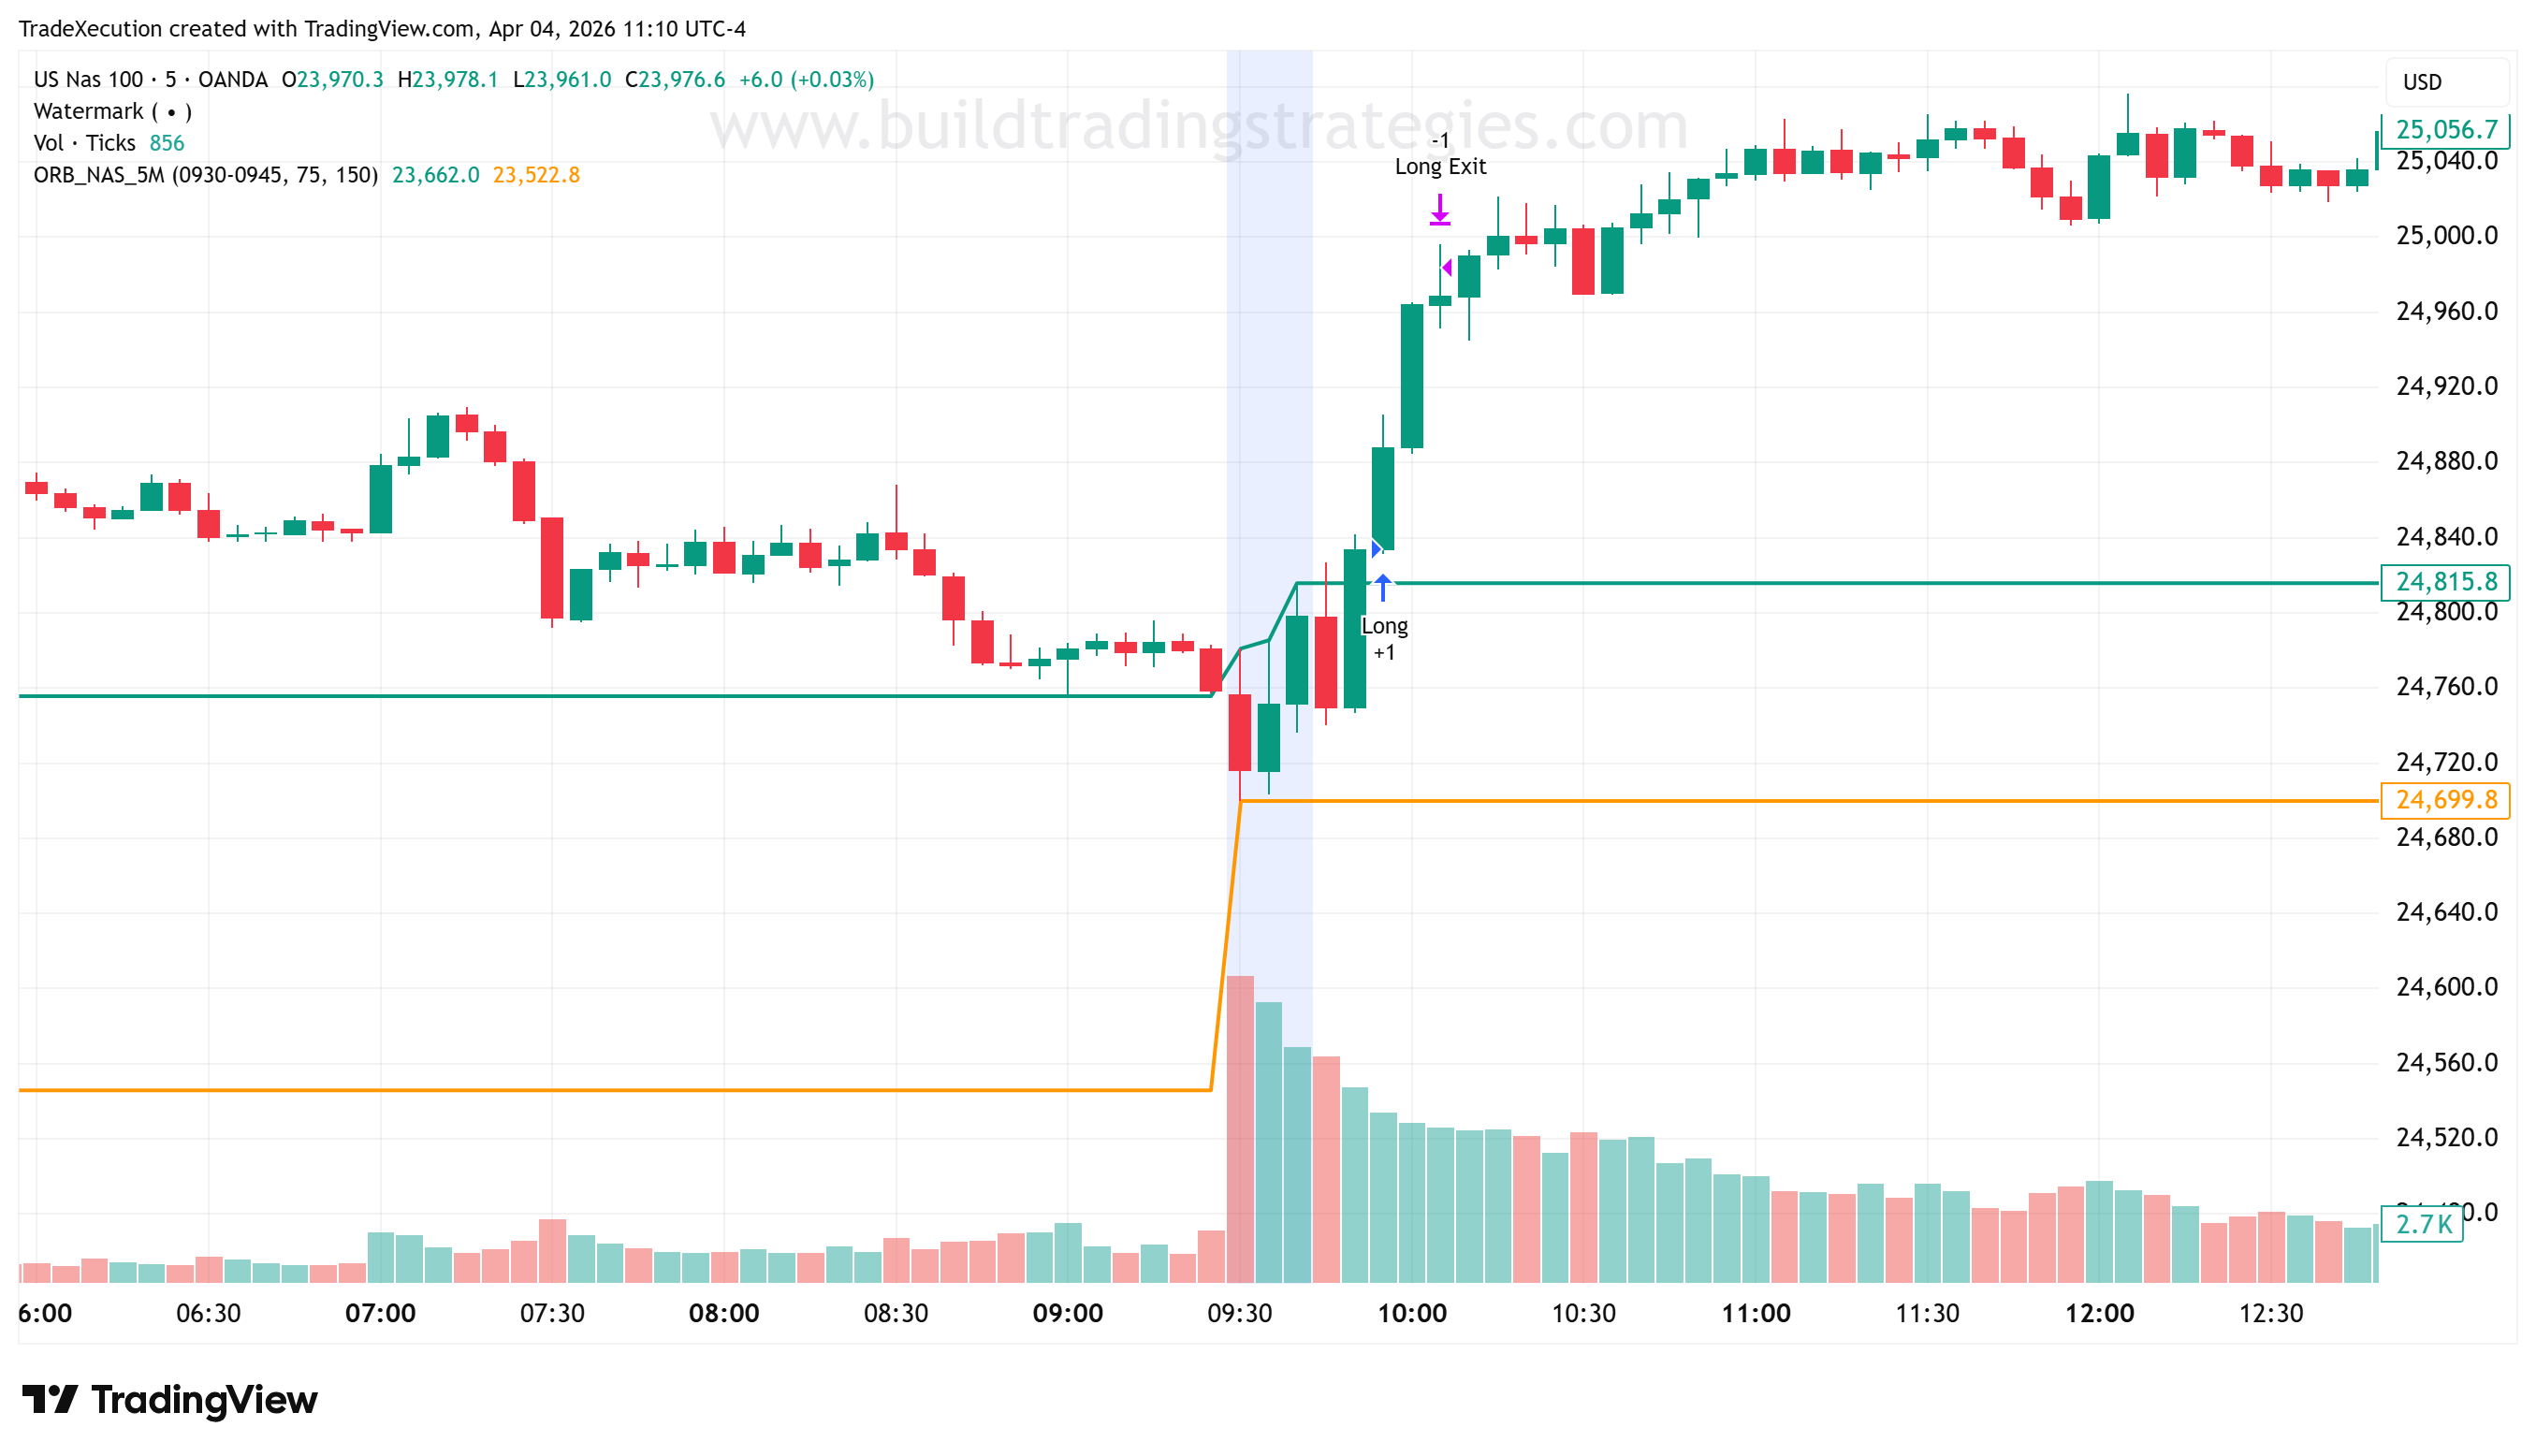
From 9:45 onwards, the question is simple: will price break convincingly above the ORB High or fall through the ORB Low? Here is what it looks like when the long break works:
But it would be dishonest to show you only that. The same setup on a different day — where pre-market momentum was working against the direction of the break — looks like this:
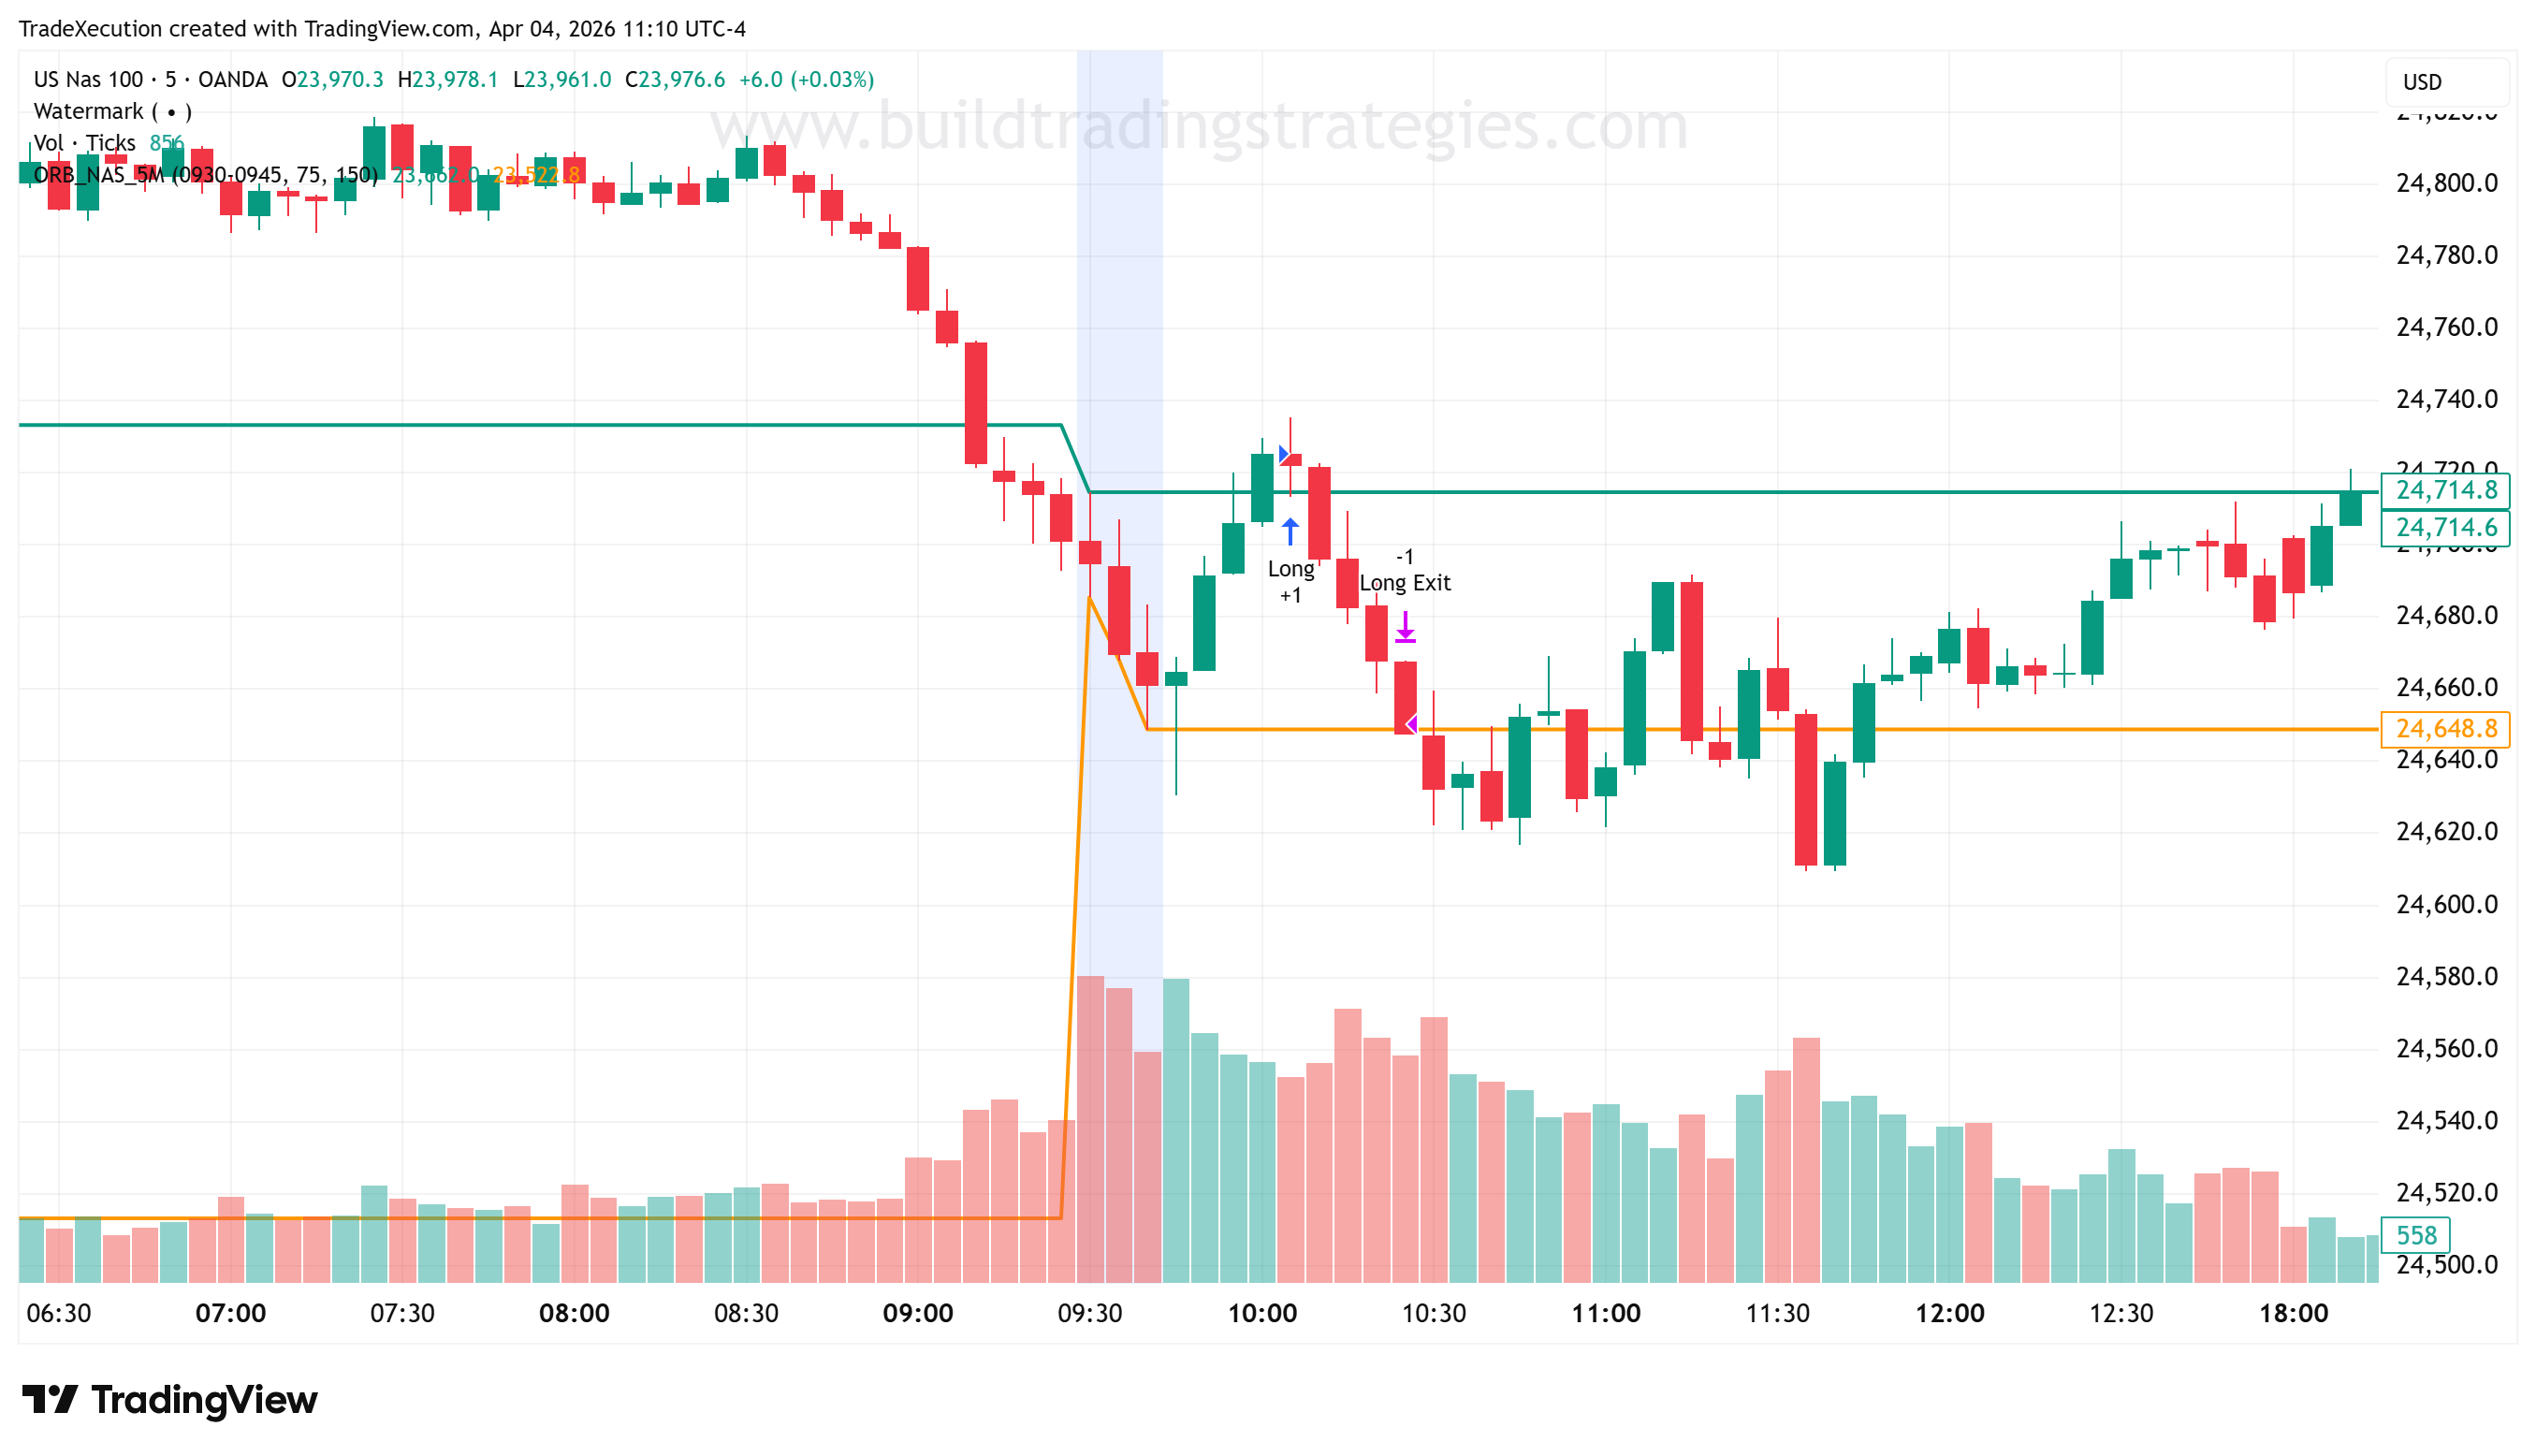
Both of these outcomes are part of the strategy. A raw ORB wins roughly a third of the time, which sounds alarming until you realise the wins are designed to be twice the size of the losses. A system like this is profitable with a win rate well below 50% provided the win/loss ratio is structured correctly. The mathematics work — but you have to be prepared to sit through the failed days without abandoning the rules.
//@version=6
strategy("Opening Range Breakout", overlay=true, default_qty_type=strategy.percent_of_equity, default_qty_value=100)

// Inputs
orbMinutes = input.int(30, "ORB Window (minutes)", options=[15, 30, 60])
tpMult = input.float(1.5, "Take Profit Multiplier")
slMult = input.float(1.0, "Stop Loss Multiplier")

// Session timing
isNewDay = ta.change(time("D")) != 0
var float orbHigh = na
var float orbLow = na
var bool orbDefined = false
var int barCount = 0

if isNewDay
    orbHigh := high
    orbLow := low
    orbDefined := false
    barCount := 0

barCount += 1
orbBars = orbMinutes / timeframe.multiplier

if barCount <= orbBars
    orbHigh := math.max(orbHigh, high)
    orbLow := math.min(orbLow, low)
    if barCount == orbBars
        orbDefined := true
Once the opening range is defined, the breakout logic is straightforward. The strategy uses ta.crossover() and ta.crossunder() to detect the moment price breaks through the range boundaries. Each trade is paired with calculated exit levels based on the range size, ensuring consistent risk management across different market conditions.
// Breakout logic
orbRange = orbHigh - orbLow
longBreakout = orbDefined and ta.crossover(close, orbHigh)
shortBreakout = orbDefined and ta.crossunder(close, orbLow)

if (longBreakout)
    strategy.entry("ORB Long", strategy.long)
    strategy.exit("ORB Long Exit", "ORB Long", profit=orbRange * tpMult / syminfo.mintick, loss=orbRange * slMult / syminfo.mintick)

if (shortBreakout)
    strategy.entry("ORB Short", strategy.short)
    strategy.exit("ORB Short Exit", "ORB Short", profit=orbRange * tpMult / syminfo.mintick, loss=orbRange * slMult / syminfo.mintick)

// Plot ORB levels
plot(orbDefined ? orbHigh : na, "ORB High", color=color.green, style=plot.style_stepline)
plot(orbDefined ? orbLow : na, "ORB Low", color=color.red, style=plot.style_stepline)
Window length changes the character
15, 30, and 60 minutes produce meaningfully different strategies on the same instrument:
- 15-minute window — maximum signal frequency, highest false-break rate. Suits traders who want many shots and can accept whipsaws.
- 30-minute window — the classic Crabel framing. By 30 minutes past the open, the early noise has largely settled and the range carries more weight.
- 60-minute window — fewer signals, strongest follow-through. Close to a full first-hour range; a break of this range implies meaningful directional commitment.
There is no universally correct length. Test all three on the specific instrument you intend to trade and let the backtest pick. The book The Anatomy of a 5-Minute ORB Trading Strategy uses the shorter 5-minute window specifically because it pairs better with an RSI momentum filter on NAS100; on DAX, a 15 or 30-minute window behaves differently.
Gap opens — where most ORB strategies fail silently
If the cash session opens with a meaningful gap from the prior close, the "opening range" may already be broken before your N-minute window has even closed. Two defensive rules:
- Skip trading on extreme gap days — if the open is outside the prior session's range by more than 1× ATR, sit out. The setup is already in an unusual state.
- Don't enter in the gap direction — if the day gapped up, treat an upside break of the ORB with extra scepticism (the move has already partially happened) and a downside break with more weight (it indicates the gap is failing).
Afternoon breaks behave differently
ORB signals that fire in the first 2–3 hours of the session are very different from signals that fire at 3pm. The afternoon breaks tend to be lower-quality. A common filter: restrict the strategy's trading window to (for US equities) roughly 09:45–13:00 ET. Everything after that is likely to be noise unless you have evidence otherwise on your specific instrument.
Session filter
The code above uses a simple `isNewDay` check but does not restrict WHEN the breakout can fire. In practice you should add a session filter — e.g. `inTradeWindow = not na(time(timeframe.period, "0945-1300", "America/New_York"))` — and gate the entry on `orbDefined and inTradeWindow`. Without that gate, late-afternoon and overnight breaks of the opening range will fire trades that were not the point of the strategy.
Why the raw signal isn't enough
If you tested the code above across thousands of trades on the NAS100 — which the book does — you would find something uncomfortable: the raw ORB breakout barely clears break-even. Profit Factor just over 1.0. Technically profitable. Practically useless once you account for real-world slippage and spread.
So the question isn't "does ORB work?" — the data answers that, and the answer is "barely, in its raw form". The real question is: what separates the breakouts that follow through from the ones that fail?
That is the question that drives the rest of a serious ORB system:
- A momentum filter (RSI above a specific threshold) — takes the PF from ~1.1 to ~1.4 on its own.
- A structural context filter (today's ORB vs yesterday's) — another meaningful jump in quality.
- A volatility filter (Bollinger Band width) — the question of when to tighten vs expand the trade.
- Session windowing, position sizing, break-even management — the layers that make a strategy survivable in live conditions.
Each of those is a full chapter's worth of work to get right, because the wrong version of each makes the strategy worse, not better. There are also indicator categories (trend filters, session-context filters) that look like they should help and don't — and knowing which to keep and which to discard is most of the job.
Ready to go from concept to a 23-year-tested system?
- Read the complete build — 19 chapters, 12 strategy versions, every filter decision explained.
- Buy the book — full Pine Script for every version, FTMO challenge simulation, 14-day money-back guarantee.
Everything in this article is the foundation. The book is the work that turns it into something you can trade.