Supertrend Strategy
ATR-based trailing stop strategy that flips direction when price crosses the Supertrend line.
A Supertrend strategy sounds simple on paper: buy when the indicator flips bullish, exit when it flips bearish, and follow the trend for as long as it lasts. The problem is that markets are rarely that clean.
Supertrend is a useful trend-following tool, but turning it into a tradable strategy requires more than taking every colour change on the chart. In trending conditions it can work well. In sideways conditions it can whipsaw badly. That means the real challenge is not understanding what Supertrend does. The real challenge is deciding when its signals are worth acting on.
If you want a deeper explanation of how the indicator itself works, including ATR length, multiplier, and how the line is calculated, read the Supertrend indicator guide first.
Why Supertrend is useful for strategy building
Supertrend has a few qualities that make it attractive as the foundation of a rules-based strategy.
First, it gives a very clear directional state. The line sits below price in bullish conditions and above price in bearish conditions. That makes it easy to define whether a strategy should currently be looking long, short, or not trading at all.
Second, it is volatility-adjusted. Because it is based on ATR, the line automatically gives price more room in fast conditions and less room in quieter ones. That makes it more practical than using a fixed stop distance across every market environment.
Third, it is simple enough to test properly. That matters. Many trading ideas fail not because they are too basic, but because they are too vague. Supertrend is structured enough to turn into clear entry, exit, and filter rules.
That said, simplicity cuts both ways. A strategy built around Supertrend can also become too reactive if you do not control when signals are allowed.
The problem with raw Supertrend entries
The most obvious Supertrend strategy is:
- go long when Supertrend flips bullish,
- exit when it flips bearish.
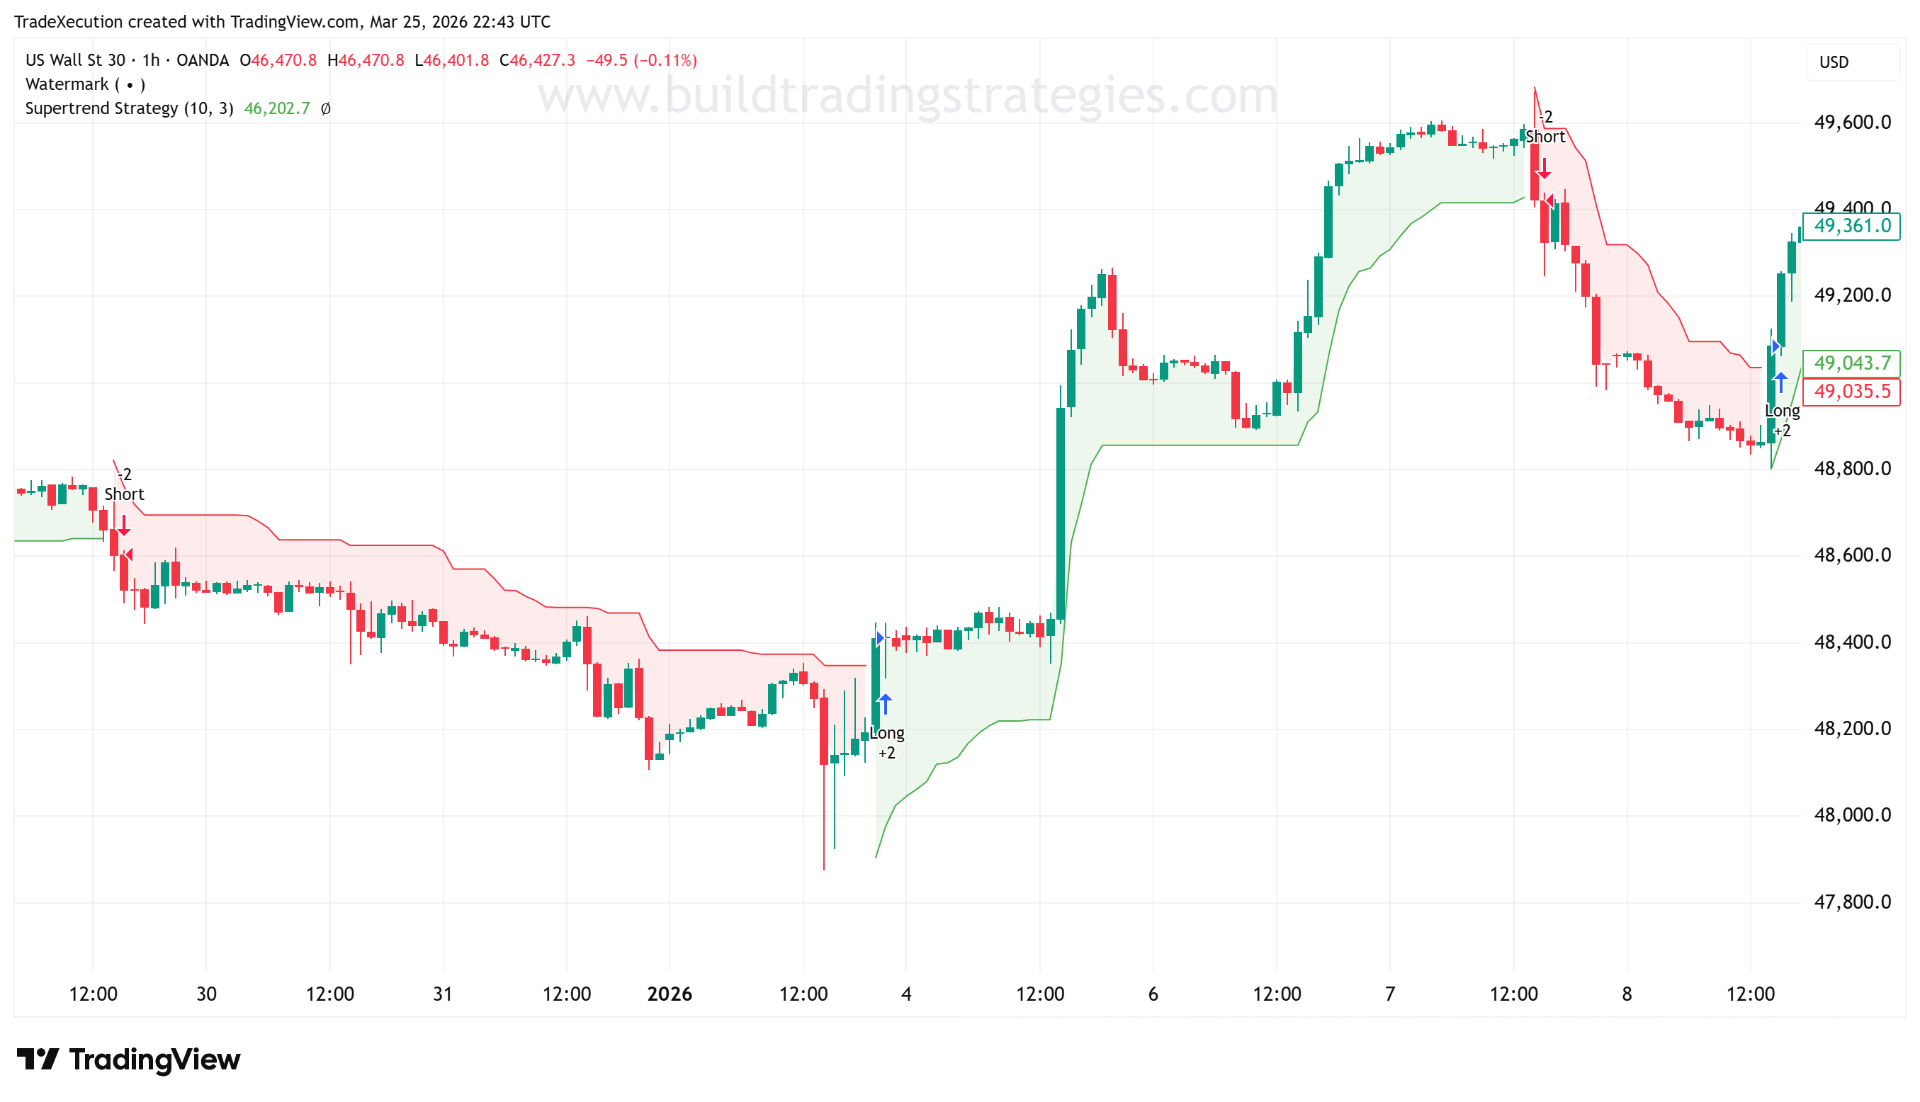
In the short term, that may work however that's unlikely to be a very profitable long term strategy. The issue is that Supertrend is still a lagging trend-following tool. In a clean trend, that is fine. In a range, price can cross back and forth through the line repeatedly. That creates a string of small losses with no sustained move to recover them. This is why a raw Supertrend strategy often looks acceptable on a chart screenshot - almost too simple - but it doesn't fair well in a proper backtest. The chart highlights the big runs. The backtest exposes how poorly it will perform when the markets are consolidating.
A make the Supertrend strategy more usable, it needs to be paired with another indicator that is able to identify when the markets are consolidation or atleast, avoid spending as much time in those periods. Typically, the following are going to help:
- a broader trend filter,
- a momentum confirmation filter,
- a session or market selection rule,
- better stop logic,
- or tighter rules around when entries are allowed.
A supported Supertrend strategy
My preferred way to use Supertrend is not as a stand-alone signal generator, but as the primary trigger inside a long-biased filtered strategy. That long bias matters.
I'm typically trading broad equity indices. One of the first things I want to establish is whether the strategy should really be trading both directions at all. In my experience, the most profitable use of most indicators on the indices is often on the long side. All you need to do is look at any chart over 10+ years and you'll see the overall long bias. Indices have a structural tendency to reward bullish trend-following, and bearish signals on an index can easily appear during a pullback or a burst of volatility, only for price to recover and resume the broader uptrend.
So rather than starting with a symmetrical model, I prefer to start long-only, filter those longs using broader trend direction, and only revisit the other side later if the data clearly justifies it. That approach is usually cleaner, easier to understand, and often more profitable on indices.
Favouring the long side will help significantly however we still need a way to filter out more short term consolidation and reversals. To that end, supplementing the strategy with a higher valued moving average (MA) should help. Additionally, we want to ideally buy when momentum is in our favour. A typical version of this idea might look like this:
| Component | Role | Question it answers | |---|---|---| | Supertrend | Immediate bullish trend flip | Has the short-term trend state turned bullish? | | MA | Broader trend bias | Is the broader direction supportive of longs? | | RSI | Optional momentum confirmation | Is momentum confirming the move? |
That is a much better structure than taking every Supertrend flip and hoping the market behaves cleanly.
Example strategy logic
This example uses three layers:
- a confirmed Supertrend flip to the long side,
- a long-term EMA filter as our MA,
- an optional RSI confirmation filter.
Long rules
Enter long when:
- Supertrend flips bullish on a confirmed bar close,
- price is above the 200 EMA,
- and RSI is above 50 if the RSI filter is enabled.
Exit rules
Exit long when:
- Supertrend flips bearish,
- or price hits the current Supertrend line used as a trailing stop.
That structure keeps the strategy focused on the side of the market that often behaves most cleanly on indices. It also gives the trade room to stay open while the trend remains intact, rather than forcing a fixed target that may cut strong bullish runs short.
Why these filters help
The EMA filter helps solve one of the biggest problems with raw Supertrend signals: taking trades against the broader market structure.
For example, if price is below a falling 200 EMA, then a bullish Supertrend flip is often just a temporary bounce inside a larger downtrend. Blocking those entries removes a lot of low-quality signals. When price is above a rising 200 EMA, that same filter keeps the strategy aligned with the broader direction of the market, which is exactly where a trend-following indicator like Supertrend tends to perform best.
The RSI filter adds another layer of quality control. I would not use it here as a traditional overbought or oversold signal. A much better use is simply to treat RSI above 50 as supportive bullish momentum. That helps avoid entries where Supertrend flips bullish but the move still lacks real momentum.
Neither filter is magic. The goal is not to predict every winning trade. The goal is to cut out the weaker Supertrend signals and focus the strategy on the conditions where it is most likely to perform well.
Risk management matters more than the entry
A Supertrend strategy is still only as good as its risk model.
Even if the entry logic is sound, poor position sizing can ruin the whole system. This is especially important if you are trading small timeframes, volatile instruments, or prop-firm style constraints where daily loss and max drawdown matter more than raw expectancy.
A practical approach is:
- decide how much capital you are willing to risk on each trade,
- calculate the stop distance from entry to the Supertrend line,
- convert that distance into position size,
- round the size to match the broker's minimum and step requirements.
In other words, the Supertrend line can define more than your exit. It can also define the initial risk distance.
That is often far more robust than choosing an arbitrary lot size and hoping the stop happens to make sense.
// This Source Code Form is subject to the terms of the Mozilla Public
// License, v. 2.0. If a copy of the MPL was not distributed with this
// file, You can obtain one at https://mozilla.org/MPL/2.0/.
// Copyright (c) 2026 - BuildTradingStrategies.com / TradeXecution.com

//@version=6
strategy("Supertrend Strategy", overlay=true, pyramiding=0, initial_capital=10000)

// Inputs
atrPeriod = input.int(10, "ATR Period", minval=1)
factor    = input.float(3.0, "Supertrend Factor", step=0.1)
emaLength = input.int(200, "EMA Length", minval=1)
useRSI    = input.bool(true, "Use RSI Filter")
rsiLength = input.int(14, "RSI Length", minval=1)

// Core calculations
[supertrend, direction] = ta.supertrend(factor, atrPeriod)
emaValue = ta.ema(close, emaLength)
rsiValue = ta.rsi(close, rsiLength)

// Trend state
bullishTrend = direction < 0
bearishTrend = direction > 0

// Confirmed flips
bullishFlip = ta.change(direction) < 0 and barstate.isconfirmed
bearishFlip = ta.change(direction) > 0 and barstate.isconfirmed

// Long filter
longFilter = close > emaValue and (not useRSI or rsiValue > 50)

// Entry
longEntry = bullishFlip and longFilter

if longEntry
    strategy.entry("Long", strategy.long)

// Supertrend trailing stop
longStop = strategy.position_size > 0 and bullishTrend ? supertrend : na
strategy.exit("Long Exit", from_entry="Long", stop=longStop)

// Opposite flip exit
if strategy.position_size > 0 and bearishFlip
    strategy.close("Long")

// Plots
plot(bullishTrend ? supertrend : na, "Bullish Supertrend", color=color.green, style=plot.style_linebr, linewidth=2)
plot(bearishTrend ? supertrend : na, "Bearish Supertrend", color=color.red, style=plot.style_linebr, linewidth=2)
plot(emaValue, "EMA", color=color.blue)

plotshape(longEntry, title="Long Entry", location=location.belowbar, style=shape.triangleup, color=color.green, size=size.small)
This strategy is intentionally simple. That makes it easier to understand and test, but it also means there is room to refine it.
The script uses Supertrend as the primary trigger, a 200 EMA as a trend filter, optional RSI confirmation, Supertrend-based trailing stops, and confirmed-bar entries only.
How I would improve this strategy further
I've kept the base version of this strategy intentionally simple. That matters, because simple strategies are easier to understand, easier to test properly, and easier to improve without losing sight of what is actually driving performance.
Once I have that base in place, the next step is not to start adding filters at random. The next step is to look at the backtest and ask a better question: where is the strategy actually weak?
One of the first refinements I would make is to turn the RSI confirmation level into an input rather than fixing it at 50. RSI above 50 is a reasonable default because it suggests bullish momentum, but I would not assume it is the best value for every market. In some cases, a higher threshold such as 55 or 60 can do a better job of filtering out weaker long entries and forcing the strategy to participate only when momentum is more clearly aligned. The trade-off is that stronger filtering usually means fewer trades and sometimes later entries, so this is something I would always test rather than hardcode.
Beyond that, these are the main extensions I would consider.
Add an ADX filter to block weak-trend conditions. Supertrend tends to perform best when the market is actually trending. If the backtest shows repeated losses in sideways conditions, adding ADX can be a sensible way to avoid taking flips when trend strength is weak.
Restrict trading to specific sessions. Some markets behave far better during their main session than they do during quieter periods. If the strategy is taking low-quality entries outside the best trading hours, I would test whether session filtering improves the results.
Require a retest of the Supertrend line before entry. Instead of entering immediately on the initial flip, I can require price to pull back and confirm the move. That can help avoid chasing entries after an already extended move, although it may also reduce trade frequency and miss some strong breakouts.
Use fixed-risk position sizing. This is one of the most practical improvements because it strengthens the strategy without changing the core entry logic. I want position size to be driven by the stop distance and the amount I am prepared to lose on the trade, not by an arbitrary lot size or contract size.
Add a higher-timeframe directional filter. A lower-timeframe Supertrend entry often becomes more reliable when it is aligned with the broader direction on a higher timeframe. That is a simple way to stop the strategy from fighting the larger market structure.
The right improvement depends entirely on what the backtest is telling me.
If the strategy struggles in chop, I would look at adding a trend-quality filter such as ADX or a higher-timeframe bias. If entries are too late, I would look at reducing lag by testing different Supertrend settings or lowering the RSI confirmation threshold. If there are too many weak entries, I would test whether increasing the RSI requirement from 50 to 55 or 60 improves trade quality. If drawdowns are too large, I would fix the risk model first before I touched the signal logic.
That is really the key point: I do not want to keep adding filters just to make the strategy look more sophisticated. I want each change to solve a specific problem the testing has already exposed.
Who this strategy suits
A Supertrend strategy suits traders who want:
- a clear rules-based trend-following framework,
- a visually simple system,
- and something that can be tested, filtered, and extended without becoming overly complex.
It is less suitable for traders who want frequent reversal entries or who expect every signal to fire near the exact turning point. That is not what Supertrend is designed for.
A note on trading the other side
Everything above assumes a long-biased framework, which fits broad equity indices well. On forex, commodities, or other markets with more balanced two-way behaviour, the same Supertrend logic can be mirrored with a suitable downtrend filter, and a symmetrical long/short version may well outperform a long-only one. The sensible path is still to benchmark long-only first and only add the other side if the data clearly justifies it.
Final thoughts
Supertrend is a useful building block for a strategy, but it is rarely enough on its own.
The strongest way to use it is usually as a trigger inside a broader framework that controls direction, momentum, and risk. Once you do that, it becomes much more than just a line flipping from green to red. It becomes a structured way to participate in trends while staying honest about where trend-following systems tend to fail.
If you want to understand the mechanics behind the line itself, including ATR length, multiplier, and how the indicator works under the hood, go back to the Supertrend indicator page.