Supertrend
Supertrend is one of the cleanest trend-following indicators available to retail traders. It takes market volatility, measured using Average True Range (ATR), and turns it into a single line on the chart that flips as market direction changes. When the line sits below price, the market is considered bullish. When it sits above price, the market is considered bearish.
That simplicity is exactly why Supertrend has become so popular. It is easy to read, visually clear, and useful across intraday, swing, and position-trading timeframes. It can also be applied across different instruments including stocks, futures, and forex.
The important thing to understand, though, is that Supertrend is not a magic signal generator. It is a trend tool. In strong directional markets it can be extremely useful. In sideways markets it can flip too often and generate poor entries. That is why it usually works best when paired with another form of confirmation rather than used completely on its own.
If you want to see how to turn the indicator into a testable trading system, read the Supertrend Strategy guide.
What is the Supertrend indicator?
The Supertrend indicator is a trend-following overlay based on ATR. TradingView describes it as an indicator whose single line combines volatility and trend detection, and notes that it can be used both to detect changes in trend direction and to position stops. Investopedia similarly describes it as a tool that uses ATR and a multiplier to plot a line above or below price in order to identify trend shifts.
Supertrend was created by Olivier Seban, a French trader and author, who popularised it through his trading work in the 2000s. Its global spread is closely tied to TradingView, where community Pine Script versions made it one of the platform's most used overlays, and it is particularly well known in Indian equity and derivatives markets, where broker and screener platforms feature it prominently. ATR, the volatility measure that sits underneath the indicator, was introduced earlier by J. Welles Wilder Jr. as a way of measuring how much price typically moves over a period. That combination is what gives Supertrend its defining characteristic: it does not sit at a fixed distance from price. It expands when volatility rises and contracts when volatility falls.
How Supertrend works
At a high level, Supertrend starts with the average of the current bar's high and low, then offsets that value by ATR multiplied by a user-defined factor.
TradingView's formula:
hl2 = (high + low) / 2 basicUpperBand = hl2 + (multiplier × ATR) basicLowerBand = hl2 - (multiplier × ATR)
From there, the indicator maintains a trailing band and flips direction when price closes through the relevant side of the line. TradingView notes that when price rises above the curve, Supertrend turns bullish, and when price falls below the curve, it turns bearish.
The reason ATR matters here is simple: ATR measures volatility, not direction. Wilder's ATR looks at the true range of price movement and averages it across a chosen period. That means Supertrend automatically gives the market more room when it is moving violently and less room when it is calm.
This is one of the reasons Supertrend often feels more practical than a fixed-width stop or a simple moving average crossover. It adapts to the market's current behaviour rather than assuming every environment should be treated the same way. That does not make it predictive, but it does make it structurally sensible as a trend overlay. The indicator is still lagging, because it reacts to price movement rather than forecasting it.
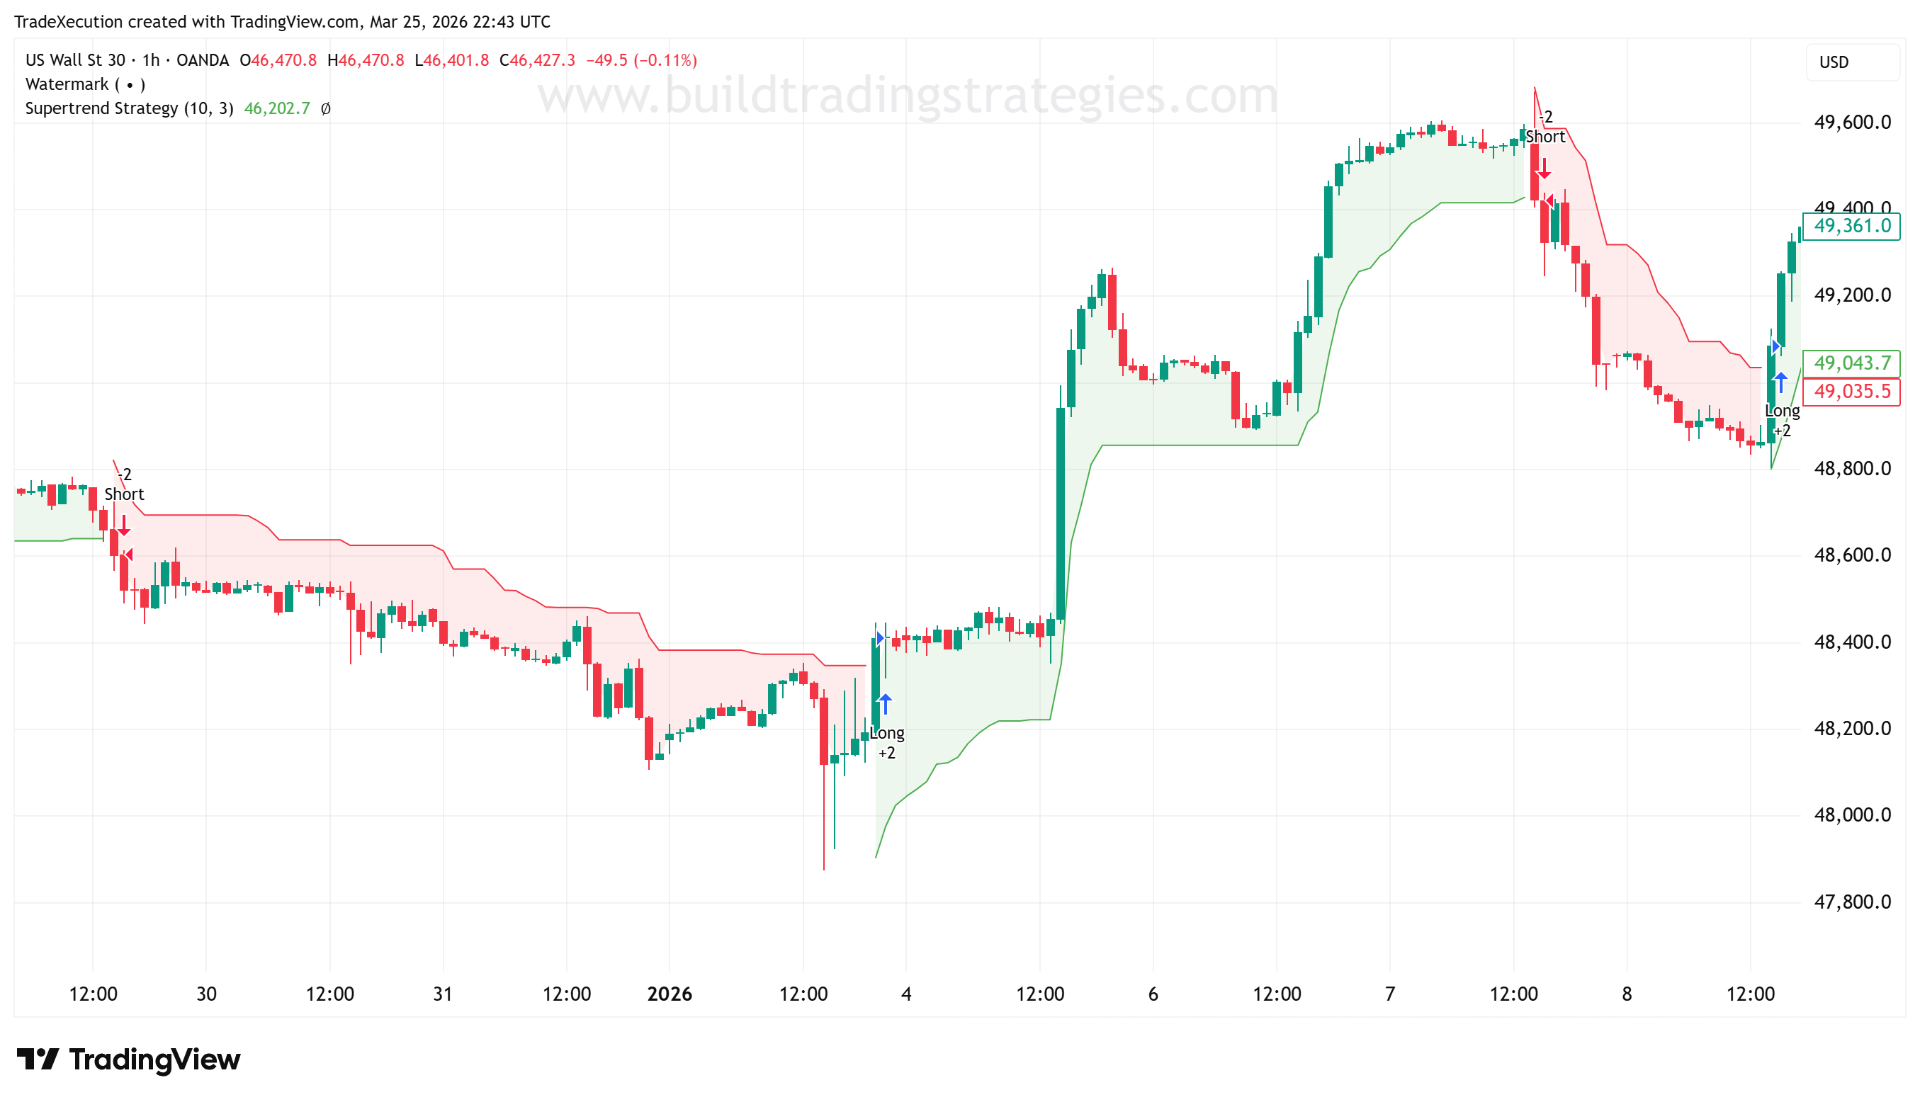
How to read Supertrend on a chart
The most basic read is straightforward:
- Line below price: bullish trend state
- Line above price: bearish trend state
- Price crosses the line: possible trend-state change
That visual clarity is the main appeal of the indicator. You do not need to interpret multiple oscillators or decipher several moving averages. Supertrend reduces the chart to a single directional guide.
The mistake many traders make is assuming every flip is automatically tradable. In reality, a flip only tells you that price has moved far enough relative to ATR for the trend state to change. It does not tell you whether the market is clean, whether momentum is strong, or whether you are entering directly into resistance, exhaustion, or chop. Investopedia explicitly notes that Supertrend does not tell you the magnitude of trend strength, only direction.
Supertrend settings explained
Supertrend has two main inputs: ATR length and multiplier. TradingView defines the ATR length as the lookback used for the ATR calculation, and the multiplier as the value used to offset the bands from price.
ATR length
A shorter ATR length makes the indicator more reactive. It will adjust more quickly to recent volatility, which usually means faster flips and more signals. A longer ATR length smooths that volatility measurement, which usually means slower flips and fewer signals. ATR itself is commonly calculated over 14 periods by default in many contexts, although traders often shorten or lengthen that depending on how reactive they want the indicator to be.
Multiplier
The multiplier controls how far the Supertrend line sits from price. A lower multiplier creates a tighter line, so price crosses it more easily. That makes the indicator more sensitive, but also more vulnerable to whipsaws. A higher multiplier places the line further away, reducing noise but often making entries later. Investopedia notes that smaller ATR settings and smaller multipliers create more signals, while larger settings do the opposite.
What that means in practice
If your chart looks too noisy, your settings are probably too reactive for that market and timeframe. If the indicator barely flips at all and feels unusably slow, your settings are probably too wide. Supertrend settings are not "right" or "wrong" in isolation. They are only appropriate or inappropriate relative to the market structure you are trying to trade. That is why testing matters more than copying someone else's default values.
What Supertrend is good at
Supertrend is useful because it does a few jobs very clearly.
First, it is an effective trend-state filter. It quickly tells you whether the current regime is bullish or bearish according to its own volatility-adjusted logic.
Second, it is a practical trailing-stop reference. Investopedia notes that traders often use the Supertrend line itself as a stop reference, placing stops at or beyond the line depending on direction.
Third, it is flexible across markets and timeframes. TradingView states that it can be used on intraday, daily, and weekly periods and across instruments such as stocks, futures, and forex.
Finally, it is just easy to interpret. That matters more than people sometimes admit. Indicators that are visually simple are easier to execute consistently than indicators that require too much interpretation under pressure. Investopedia also lists ease of use and customization as key strengths.
Where Supertrend struggles
Supertrend's biggest weakness is sideways price action. Investopedia notes that it can produce false signals in choppy, rangebound markets and explicitly describes it as less effective there. TradingView also warns that it can generate false signals and works best with other indicators.
This happens because the indicator is fundamentally reactive. When the market alternates direction without establishing a real trend, price can keep crossing the line and forcing frequent flips. That creates exactly the kind of stop-out behaviour trend traders hate most: repeated small losses with no sustained move to pay for them.
It also does not measure trend strength. A bullish Supertrend only tells you that price is above the line. It does not tell you whether that trend is powerful, mature, weak, or close to exhaustion. That is one reason traders often pair it with tools such as RSI, ADX, moving averages, or other confirmation methods.
How traders actually use Supertrend
In practice, most experienced traders do not use Supertrend as a blind "buy every green flip, sell every red flip" system. They tend to use it in one of four ways.
1. As a trend filter
This is the cleanest use. If Supertrend is bullish, only look for long setups. If it is bearish, only look for short setups. That turns the indicator into a simple regime filter rather than a full entry engine.
2. As a trailing stop
This is one of the most practical uses of the indicator. Because the line is volatility-adjusted, it can act as a dynamic stop reference that gives price more room during high-volatility phases and less room during calm ones. Investopedia specifically highlights stop-loss placement as a practical application of Supertrend.
3. As a higher-timeframe bias tool
A higher-timeframe Supertrend can define the broad direction, while entries are executed on a lower timeframe using price action, pullbacks, or a second confirmation. TradingView notes that Supertrend can be used across intraday, daily, and weekly periods, which makes this type of multiple-timeframe use logical.
4. As part of a confirmation stack
TradingView recommends combining Supertrend with other indicators, and Investopedia notes that traders often use it with moving averages, RSI, MACD, stochastic tools, or ADX-style trend-strength measures. In practice, the best combinations are usually the ones that give each component a different job rather than stacking several indicators that all say the same thing.
Good indicators to pair with Supertrend
Supertrend works best when it is paired with something that fills one of its gaps.
Supertrend + ADX
This is a strong pairing because Supertrend gives direction while ADX can help judge whether trend strength is actually present. That is useful because one of Supertrend's main weaknesses is frequent flipping in low-quality, sideways environments. Investopedia specifically mentions average directional index as a complementary tool.
Supertrend + EMA
A higher-timeframe or longer-term moving average can act as a directional filter. For example, a trader might only take bullish Supertrend flips when price is above a long-term EMA. TradingView and Investopedia both note that Supertrend is best used with other indicators, and moving averages are one of the most common pairings.
Supertrend + RSI
RSI works well when it is used as a momentum confirmation tool rather than just a 70/30 reversal signal. If Supertrend flips bullish and RSI is already holding above its midline, that is often a cleaner sign than taking the flip in isolation. TradingView and Investopedia both list RSI as a suitable companion indicator.
What to avoid
The usual mistake is overbuilding. Supertrend is already a lagging, trend-following tool. If you stack it with several more lagging tools that all respond to the same thing, you can end up with a system that looks neat but enters far too late. The goal is not to collect indicators. The goal is to combine non-overlapping information.
Common mistakes with Supertrend
The most common mistake is trading every flip. That usually works badly in ranges.
The second mistake is using Supertrend as a complete decision engine rather than a component inside a broader process. Both TradingView and Investopedia are clear that it works best with confirmation rather than as a stand-alone tool.
The third mistake is over-optimising the settings. Because ATR length and multiplier directly affect sensitivity, it is easy to fit them too tightly to one instrument or one historical period. A setting that looked perfect in one regime can become fragile in another. Investopedia notes that finding the best settings can be tricky, which is exactly why forward robustness matters.
The fourth mistake is forgetting what ATR actually measures. ATR measures volatility, not direction. Supertrend adds directional logic on top of ATR, but the underlying volatility input is still only telling you how much price is moving, not whether the next move will continue.
Final thoughts
Supertrend is a very good indicator for what it is: a simple, volatility-adjusted trend overlay. It is easy to read, adaptable across markets and timeframes, and useful for both directional bias and trailing-stop logic. Those are real strengths.
Its weakness is that the same simplicity that makes it attractive can also make traders overtrust it. It is still a lagging indicator. It can still whipsaw badly in chop. And it still benefits from confirmation. Used properly, Supertrend is a useful building block. Used blindly, it becomes just another line that flips too often.
//@version=6
// Copyright (c) 2026 BuildTradingStrategies.com / TradeXecution.com
// This Source Code Form is subject to the terms of the Mozilla Public License, v. 2.0
// https://mozilla.org/MPL/2.0/

indicator("Supertrend Indicator", overlay=true)

atrPeriod = input.int(10, "ATR Period", minval=1)
factor    = input.float(3.0, "Factor", step=0.1)

[supertrend, direction] = ta.supertrend(factor, atrPeriod)

bullishFlip = ta.change(direction) < 0 and barstate.isconfirmed
bearishFlip = ta.change(direction) > 0 and barstate.isconfirmed

upTrend   = plot(direction < 0 ? supertrend : na, "Bullish Supertrend", color=color.green, style=plot.style_linebr)
downTrend = plot(direction > 0 ? supertrend : na, "Bearish Supertrend", color=color.red, style=plot.style_linebr)

plotshape(bullishFlip, title="Bullish Flip", location=location.belowbar, style=shape.triangleup, color=color.green, size=size.small)
plotshape(bearishFlip, title="Bearish Flip", location=location.abovebar, style=shape.triangledown, color=color.red, size=size.small)
TradingView's built-in ta.supertrend() function returns both the Supertrend value and its direction state, which makes it a clean starting point for indicators and strategies. The key thing here is that the script waits for a confirmed bar close before flagging a flip. That reduces confusion from intrabar movement and makes the signals more consistent for backtesting and alerts. The underlying concept of the built-in calculation is the same ATR-length-plus-multiplier structure described in TradingView's documentation.