Donchian Channels
A breakout indicator plotting the highest high and lowest low over a set period, commonly used in trend-following and ORB systems.
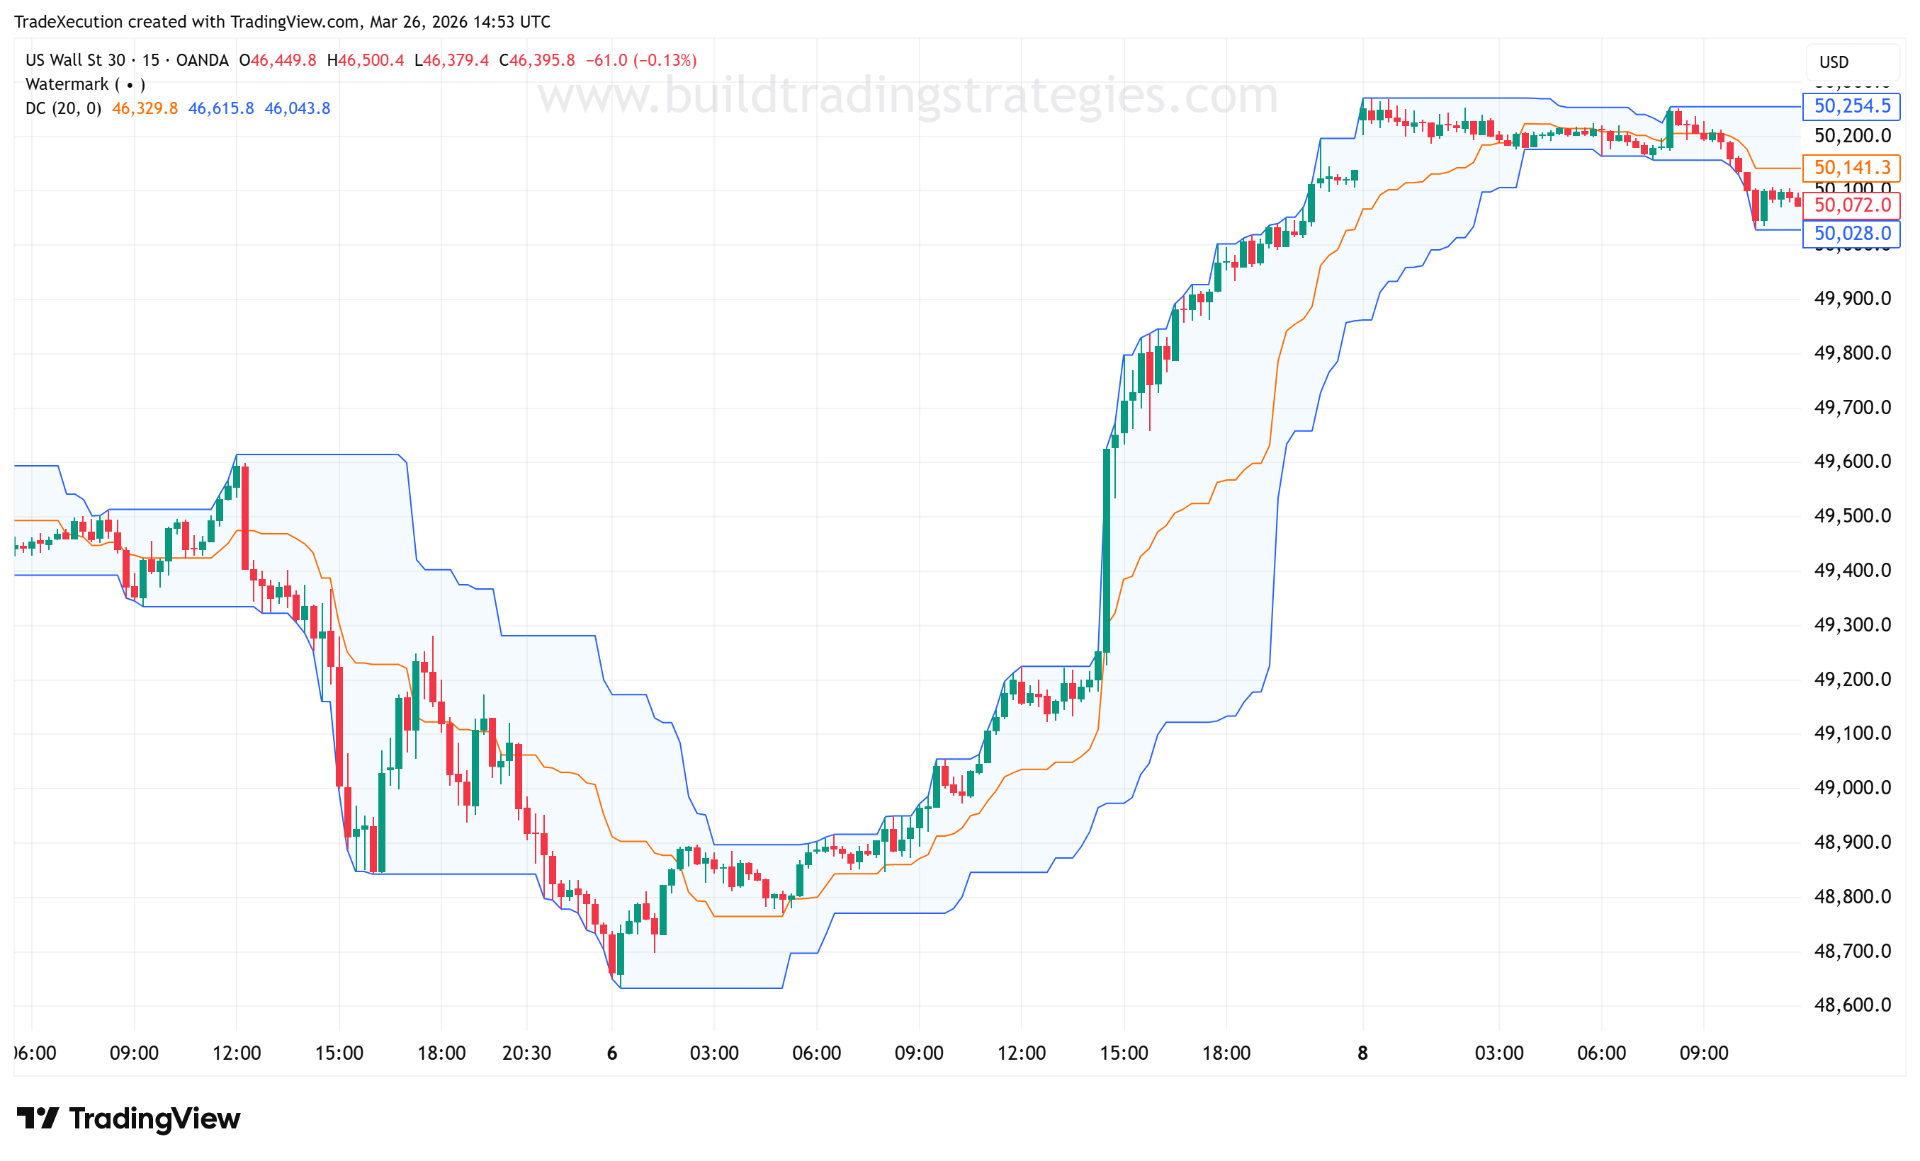
Donchian Channels plot the highest high and lowest low over a defined lookback period, forming a price envelope. The upper channel represents the highest price reached in the last N bars; the lower channel the lowest. When price breaks above the upper band, it has made a new N-period high — an objective breakout signal. When it breaks below the lower band, a new N-period low.
The 20-period Donchian Channel is the most common setting and is closely associated with trend-following systems. The "Turtle Traders" of the 1980s used a 20-period breakout system based on exactly this concept, which helped popularise it as a systematic entry mechanism.
How traders use it
### Breakout entries The simplest Donchian system: buy when price closes above the upper band, sell when it closes below the lower band. The critical implementation detail is using the `[1]` offset — measuring the channel from the previous bar's data so the current bar's price doesn't trivially satisfy its own breakout condition.
### Trend direction If price is repeatedly touching and following the upper band, that is a trending market. If price oscillates between the two bands without breaking either convincingly, that is a ranging market — and breakout entries will be unreliable.
### Midline as a target The channel midline (average of upper and lower) acts as a natural mean-reversion target for strategies that enter on band touches.
### False breakout filtering Donchian breakouts work best after compression — when ATR has been declining and the channel has been narrowing. An ADX filter or a trend bias rule significantly reduces false breakout entries.
//@version=6
indicator("Donchian Channels", overlay=true)

length = input.int(20, "Period", minval=1)

// [1] offset is critical — excludes the current bar's price to prevent look-ahead bias
upper = ta.highest(high, length)[1]
lower = ta.lowest(low,  length)[1]
mid   = math.avg(upper, lower)

bullBreak = ta.crossover(close, upper)
bearBreak = ta.crossunder(close, lower)

upperPlot = plot(upper, "Upper", color=color.blue,   linewidth=1)
lowerPlot = plot(lower, "Lower", color=color.orange, linewidth=1)
plot(mid, "Midline", color=color.gray, linewidth=1, style=plot.style_circles)
fill(upperPlot, lowerPlot, color=color.new(color.blue, 93))

plotshape(bullBreak, style=shape.triangleup,   location=location.belowbar, color=color.blue,   size=size.small)
plotshape(bearBreak, style=shape.triangledown, location=location.abovebar, color=color.orange, size=size.small)
Key takeaway: The `[1]` offset on `ta.highest` and `ta.lowest` is non-negotiable for correct breakout logic. Without it, the channel includes the current bar's own price, making the break condition trivially true at the moment it is measured. This creates look-ahead bias and produces backtest results that cannot be replicated in live trading. Always offset channel calculations by one bar.