MACD (Moving Average Convergence Divergence)
A multi-purpose indicator that blends trend-following and momentum by comparing the difference between two EMAs and a signal line.
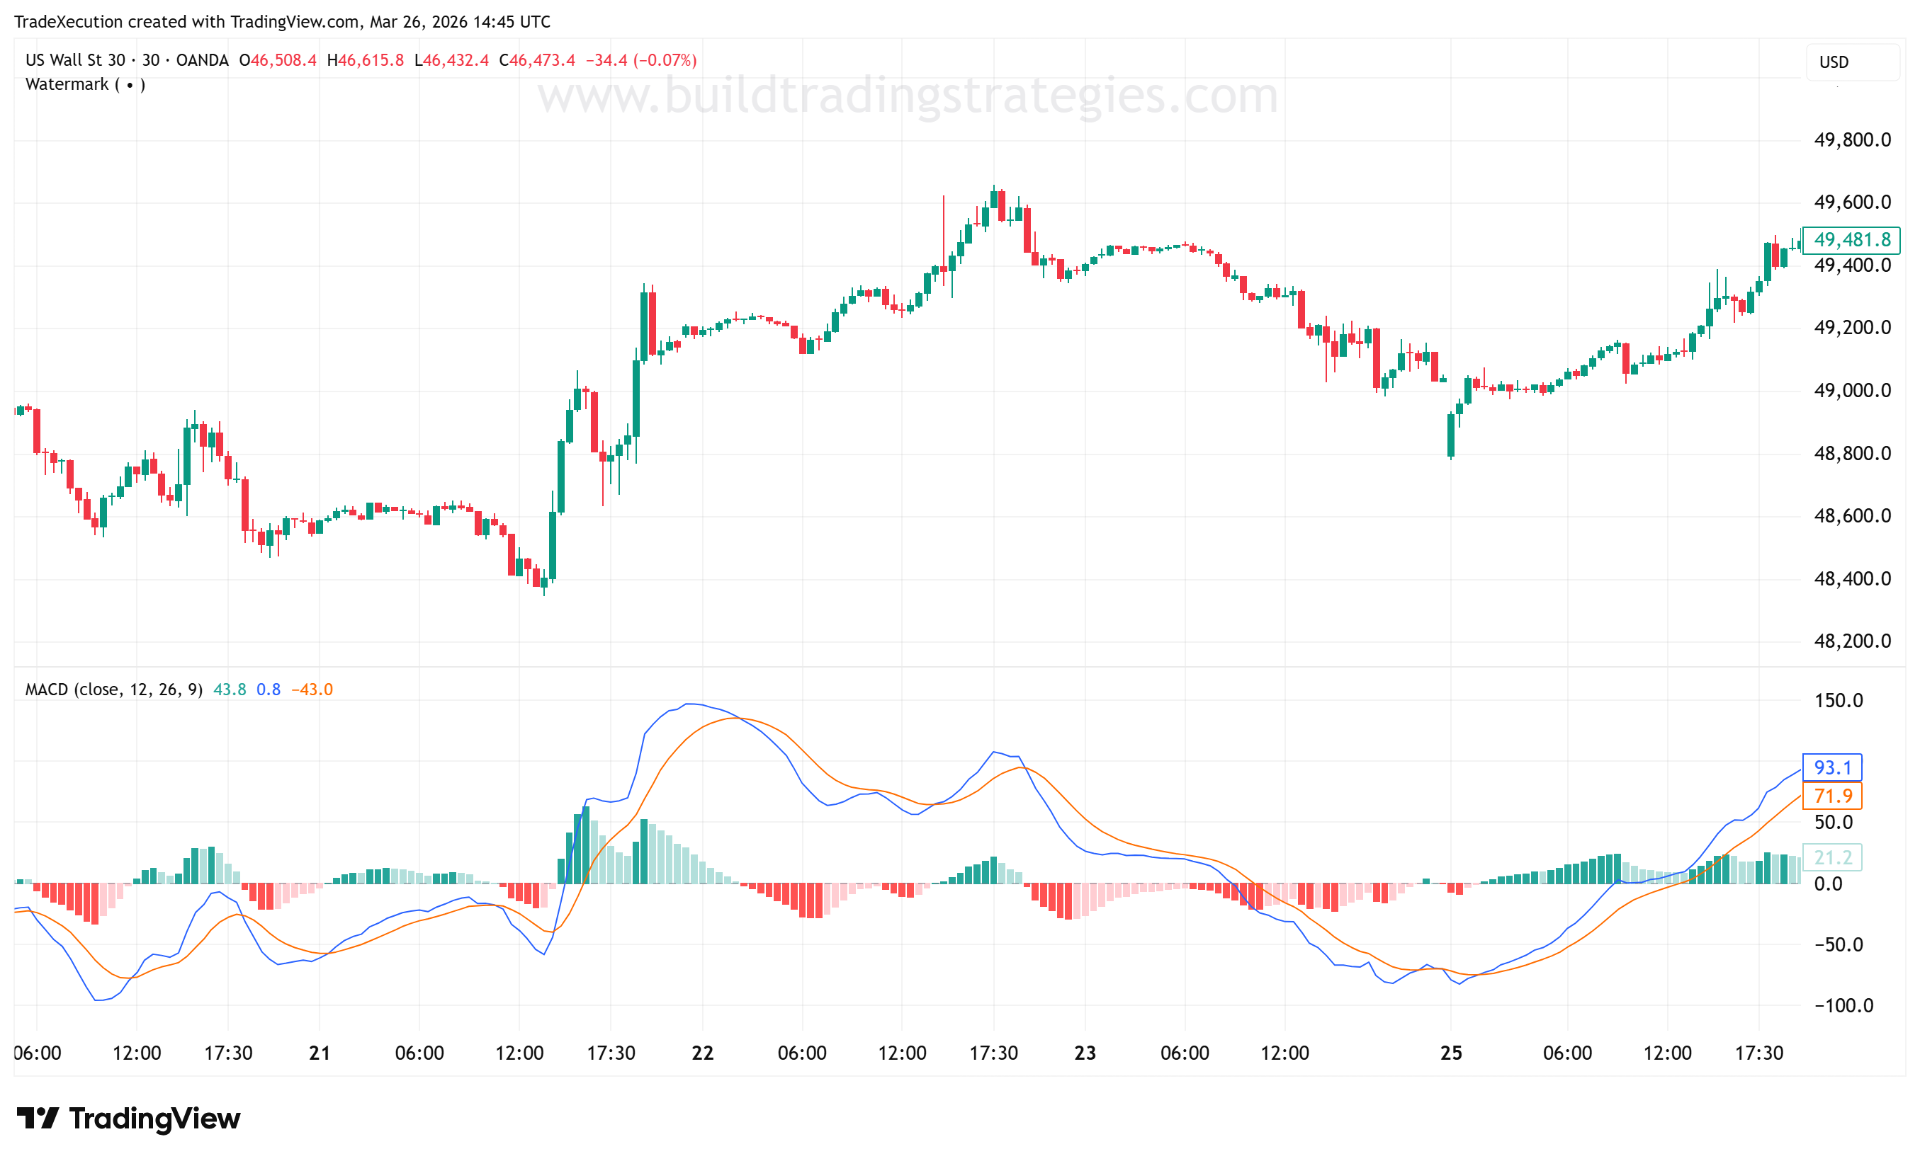
MACD is built from three components, all derived from EMAs. The MACD line is the difference between a fast and slow EMA (12 and 26 by default). The signal line is a 9-period EMA of the MACD line — a smoothed version of it. The histogram is the gap between the MACD line and the signal line, visualised as bars above or below zero.
These three elements let traders answer different questions simultaneously: is the trend up or down (MACD above/below zero), is momentum accelerating or decelerating (histogram slope), and has a new directional move just started (signal line crossover).
How traders use it
### Signal line crossovers When the MACD line crosses above the signal line, it is a common long entry trigger. When it crosses below, a short trigger. These crossovers are more reliable when they happen far from zero — a crossover deep in negative territory carries more weight than one right at zero.
### Zero-line crossovers When the MACD line crosses above zero, the fast EMA has crossed above the slow EMA — a trend change signal. This is a slower, higher-confidence version of the signal line crossover.
### Histogram slope — the most underused signal A histogram that is shrinking while still positive tells you momentum is fading before the crossover happens. That early warning is often more actionable than waiting for the lines to cross.
### Divergence If price makes a higher high but MACD makes a lower high, bullish momentum is weakening. This is divergence — a warning that the move may be running out of energy.
//@version=6
indicator("MACD Demo", overlay=false)

[macdLine, signalLine, histLine] = ta.macd(close, 12, 26, 9)

bullCross = ta.crossover(macdLine,  signalLine)
bearCross = ta.crossunder(macdLine, signalLine)

plot(macdLine,   color=color.blue,   linewidth=2, title="MACD")
plot(signalLine, color=color.orange, linewidth=1, title="Signal")

// Histogram coloured by direction
plot(histLine, style=plot.style_histogram,
     color=histLine >= 0 ? color.new(color.green, 40) : color.new(color.red, 40),
     title="Histogram")

hline(0, color=color.gray, linestyle=hline.style_dotted)

plotshape(bullCross, style=shape.triangleup,   location=location.bottom, color=color.green, size=size.small)
plotshape(bearCross, style=shape.triangledown, location=location.top,    color=color.red,   size=size.small)
Key takeaway: The histogram slope is often more useful than waiting for the crossover. A histogram shrinking from its peak — even while still positive — tells you momentum is fading before the lines actually cross. Watching the histogram rather than just the crossover puts you earlier in the move. See also: Divergence.