Parabolic SAR
A trend-following indicator that plots dots above or below price, accelerating toward price as the trend matures. Commonly used for trailing stops and trend direction.
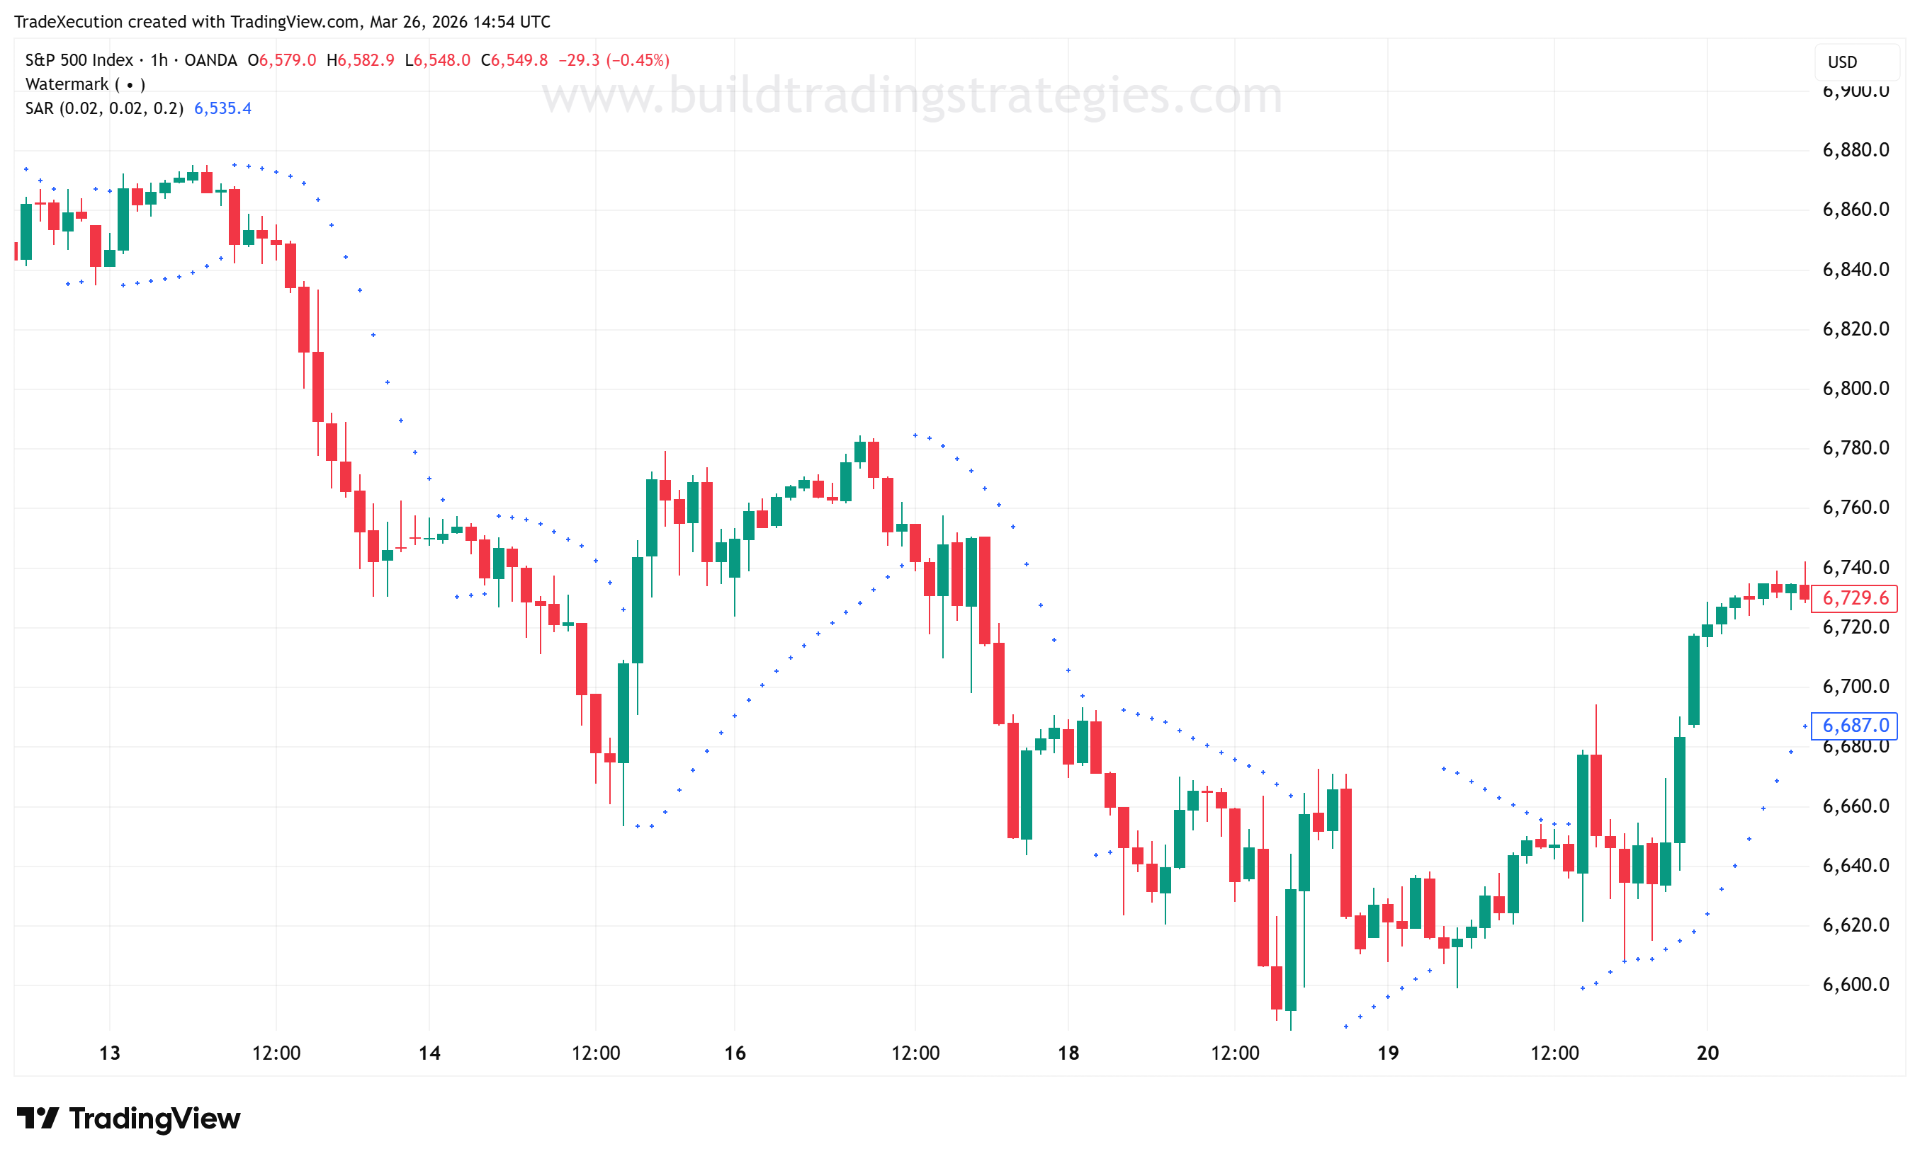
Parabolic SAR (Stop and Reverse) plots a series of dots above or below price to indicate trend direction and suggest trailing stop levels. Introduced by J. Welles Wilder in 1978 in New Concepts in Technical Trading Systems (alongside RSI, ATR, and ADX), it remains one of the clearest visual tools for disciplined trailing-stop placement. When dots are below price, the trend is up. When they flip above price, the trend is down. The "parabolic" name comes from how the dots accelerate toward price as the trend matures — the acceleration factor (AF) increases each bar that a new extreme is made, pulling the stop progressively closer.
The three inputs control its behaviour: the starting AF (how sensitive it is at the beginning of a new trend), the increment (how quickly the AF grows), and the maximum AF (how close the dots can get to price at most).
The formula
Each bar, Parabolic SAR updates according to:
``` SAR_next = SAR_current + AF × (EP − SAR_current) ```
- Where:
- SAR_current is today's SAR value
- EP (Extreme Point) is the highest high of the current uptrend (or the lowest low of the current downtrend)
- AF (Acceleration Factor) starts at the Start value (default 0.02) and increments each time a new EP is reached, up to the Max (default 0.2)
When price crosses the SAR line, the indicator flips: the SAR resets to the opposite extreme (the EP of the trend that just ended), AF resets to the Start value, and a new trend begins. That flip is the mechanic behind both the exit of the old trade and the entry of the new one.
How traders use it
### Trailing stop placement The most direct use: hold a long position with a stop at the current SAR dot. As price rises, the dot rises with it and accelerates — giving the trade more room early (when the trend is fresh and needs space) and tightening progressively as the trend matures (when a reversal is more likely).
### Flip signals When the dots flip from above to below price, Parabolic SAR is signalling a potential long entry. When they flip from below to above, a potential short. The flip is clean and objective.
### The core weakness — choppy markets Parabolic SAR performs poorly when price is oscillating without directional conviction. In a ranging market, the dots flip back and forth repeatedly, generating a string of small losses. It is designed for trending conditions and should almost always be paired with an ADX threshold or a trend filter.
### Comparison with Supertrend Both Parabolic SAR and Supertrend are trailing stop indicators, but they use different calculations. Supertrend is ATR-based and adapts to volatility automatically. Parabolic SAR uses a fixed acceleration factor. In volatile conditions, Supertrend tends to give the trade more room; in steady trends, Parabolic SAR can track price more closely.
//@version=6
indicator("Parabolic SAR Demo", overlay=true)

start     = input.float(0.02, "Start AF",     minval=0.001, step=0.001)
increment = input.float(0.02, "Increment AF", minval=0.001, step=0.001)
maximum   = input.float(0.2,  "Max AF",       minval=0.01,  step=0.01)

sar       = ta.sar(start, increment, maximum)
inUptrend = sar < close   // dot below price = uptrend

// Flip detection: trend changed on this bar
bullFlip  = inUptrend and not inUptrend[1]   // just turned bullish
bearFlip  = not inUptrend and inUptrend[1]   // just turned bearish

// Trend filter: only take SAR flips in direction of 200 EMA
ema200     = ta.ema(close, 200)
trendUp    = close > ema200

plot(sar, "SAR",
     style=plot.style_cross,
     color=inUptrend ? color.green : color.red,
     linewidth=2)

// Filtered flip markers — only show signals aligned with EMA trend
plotshape(bullFlip and trendUp,  style=shape.triangleup,   location=location.belowbar, color=color.green, size=size.small)
plotshape(bearFlip and not trendUp, style=shape.triangledown, location=location.abovebar, color=color.red, size=size.small)
Key takeaway: Parabolic SAR is a powerful trailing stop in trending markets and a liability in ranging ones. The acceleration factor is what makes it parabolic — it starts gentle and tightens progressively, which is exactly the right behaviour for a mature trend. Always combine it with a trend filter or ADX threshold. Without one, you will give back gains in choppy conditions repeatedly.