The 10 Rules of Genuine Backtesting in TradingView
Why most strategy backtests are wrong — and how to avoid the same mistakes.
Backtesting is one of the most powerful tools available to traders. With the right data and a well-constructed strategy, it is possible to evaluate trading ideas across thousands of historical market conditions in a matter of seconds. However, many backtests are unintentionally flawed. This guide covers the ten fundamental rules that separate honest, realistic backtests from misleading ones.
Platforms such as TradingView make backtesting extremely accessible. With Pine Script strategies, traders can simulate entries, exits, and position management on historical data to determine whether a trading idea has the potential to be a profitable strategy.
However, there is a major problem. Many backtests are unintentionally flawed. A strategy might show exceptional performance historically — high win rates, low drawdowns, and steady equity growth — yet fail almost immediately when traded live.
This disconnect usually occurs because the strategy violates one or more fundamental rules of honest and realistic backtesting.
What is honest (realistic) backtesting?
Honest backtesting does not attempt to "prove" a strategy will work in the future. Instead, it answers a narrower and more useful question: given a specific set of rules, did this idea show a positive expectancy on a meaningful sample of historical data under execution assumptions that resemble reality?
A good backtest is a filter. It helps you reject fragile ideas early, identify the market conditions a system needs, and estimate what the strategy might feel like — trade frequency, drawdown shape, losing streaks, and so on.
Why TradingView is unique (and why it can be tricky)
TradingView is unique because it combines three backtesting tools in one place:
- Strategy Tester (Broker Emulator) — automated backtests and performance statistics
- Bar Replay — step-by-step historical simulation to visually verify behaviour
- Pine Script strategies — executable strategy code embedded directly in charts
That power comes with gotchas. Different symbols and brokers can have different data quality, sessions, spreads, and execution characteristics. If you want a concrete example of how broker constraints distort otherwise clean-looking research, the How I Build a TradingView Strategy That Matches My Broker's Constraints guide is a useful companion. Pine Script also has options that change how and when code executes (historical vs realtime, bar close vs intrabar), and community scripts may use shortcuts that inflate results.
These distortions might include access to future data, perfect execution without slippage, indicators that repaint past signals, multiple entries triggered from a single event, and position sizing that assumes unrealistic risk tolerance. When these factors are present, the strategy may appear extremely profitable in historical testing but behave completely differently in real market conditions.
Rule 1: Never Use lookahead_on
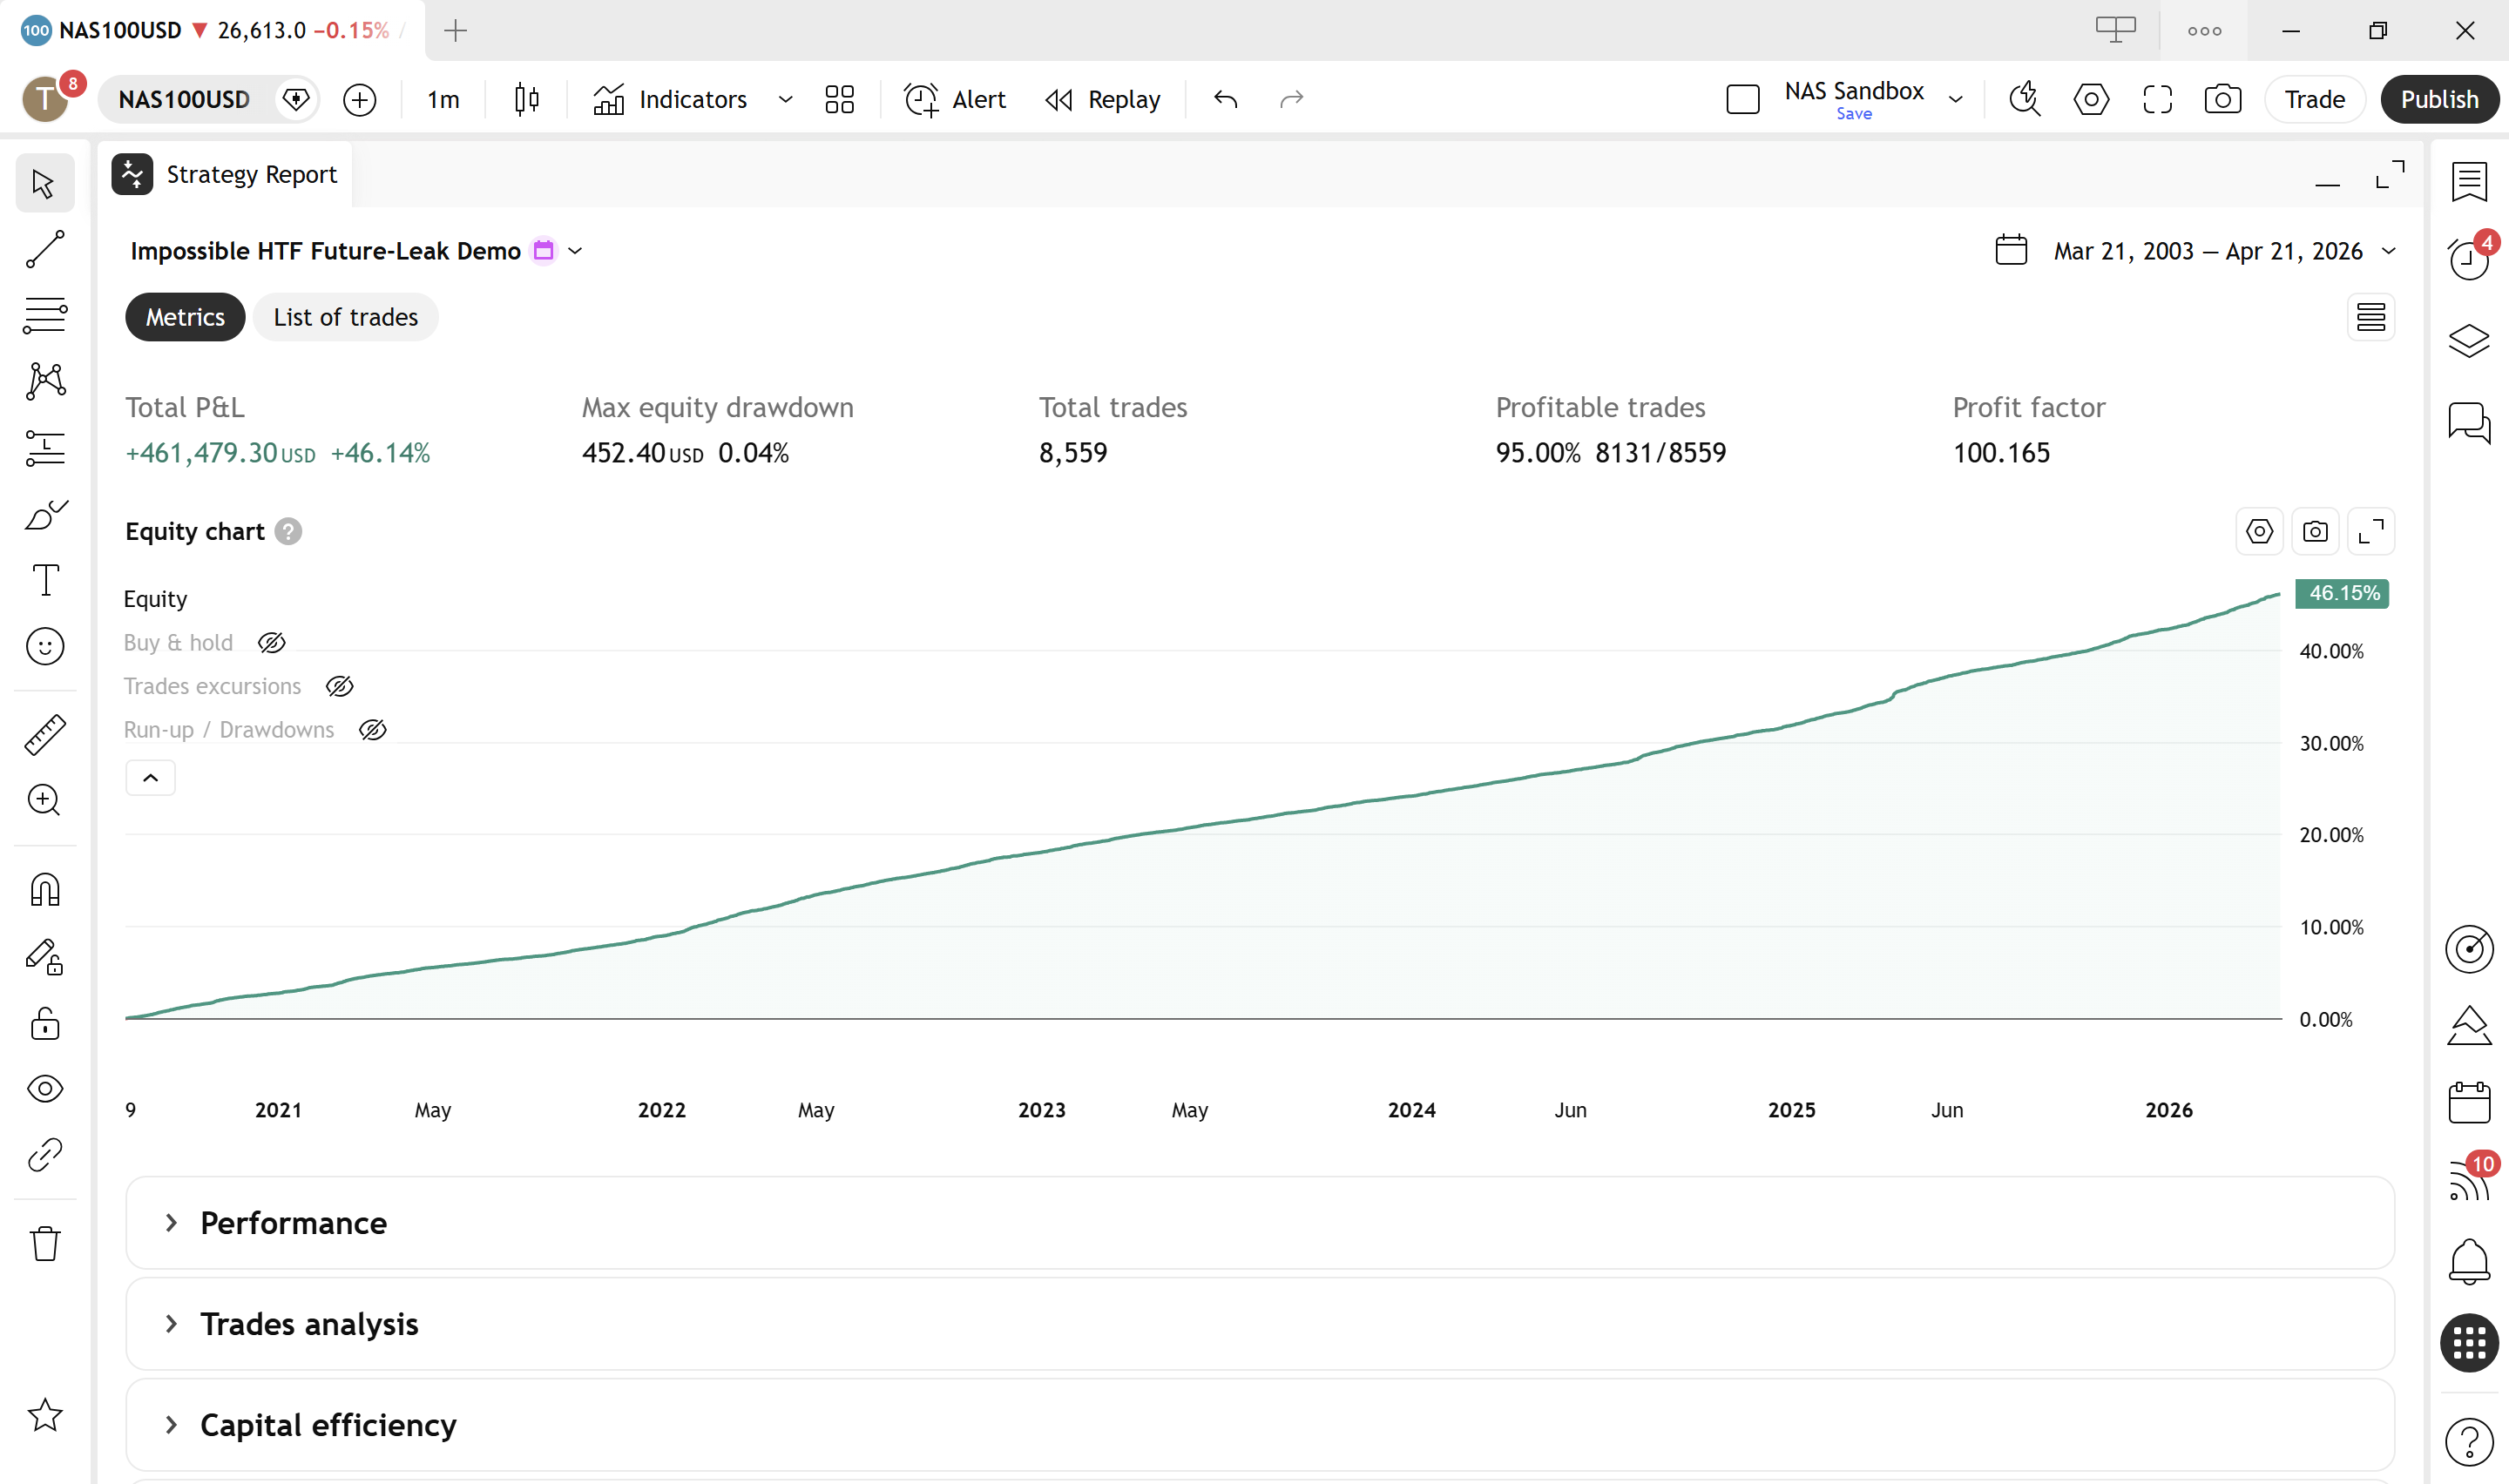
One of the most serious mistakes that can occur in Pine Script strategies is the accidental use of future data. As the opening figure shows, it is very easy to produce a strategy whose results borrow from information that would not yet exist in live trading. This problem most often appears when requesting higher timeframe data using the request.security() function.
In TradingView, the lookahead parameter controls whether the script can access the final value of a higher timeframe bar before it has actually closed.
//@version=6
strategy("Impossible HTF Future-Leak Demo", overlay=true, process_orders_on_close=true)

// Run this on a lower timeframe chart, e.g. 5m
cheatTf = input.timeframe("60", "Cheat Timeframe")

// DELIBERATE CHEAT:
// We are requesting the current HTF bar's final values with lookahead_on
// and WITHOUT a [1] offset. This creates lookahead bias on historical bars.
htfOpen  = request.security(syminfo.tickerid, cheatTf, open,  lookahead=barmerge.lookahead_on)
htfClose = request.security(syminfo.tickerid, cheatTf, close, lookahead=barmerge.lookahead_on)

// Historical bars will appear to "know" whether the current HTF candle ends up green.
willFinishGreen = htfClose > htfOpen

if willFinishGreen and strategy.position_size <= 0
    strategy.entry("Long", strategy.long)

if not willFinishGreen and strategy.position_size > 0
    strategy.close("Long")

bgcolor(willFinishGreen ? color.new(color.green, 85) : color.new(color.red, 85))
plot(htfOpen,  "Leaked HTF Open",  color=color.orange)
plot(htfClose, "Leaked HTF Close", color=color.aqua)
When lookahead_on is enabled, the strategy can see the completed value of a higher timeframe candle even though that candle has not finished forming yet in real market conditions. This effectively gives the strategy knowledge of the future.
Imagine a 1-minute strategy referencing hourly data. If lookahead is enabled, the strategy might enter trades knowing exactly how the hourly candle will close — information that is impossible to know in real trading. This produces signals that appear extremely accurate in backtests but cannot exist in live markets.
The correct approach is always to disable lookahead:
//@version=6
request.security(syminfo.tickerid, "60", close, lookahead = barmerge.lookahead_off)
This ensures that higher timeframe values only update after the candle has fully closed, replicating real-world conditions accurately. The simplest way to verify there is no future leak is to search the script source for `lookahead = barmerge.lookahead_on` — if you see it without a `[1]` offset on the requested value, the strategy is seeing the future.
The one safe exception
There is one pattern where `lookahead_on` is not only acceptable but actively recommended: the non-repainting higher-timeframe idiom. If you request the previous bar's value with a `[1]` offset and combine it with `lookahead_on`, the script sees the last closed HTF bar's value consistently across both historical and realtime bars, without peeking forward:
//@version=6
htfClose = request.security(syminfo.tickerid, "60", close[1], lookahead = barmerge.lookahead_on)
The `[1]` is doing the real work — it asks for the previous completed HTF bar — and `lookahead_on` keeps that previous-bar value aligned across history and realtime. Without both pieces together, use `lookahead_off`.
Rule 2: Trade Only on Confirmed Bars
Markets are dynamic environments where prices fluctuate constantly during the formation of each and every candle. Entry conditions that appear mid-bar may disappear before the candle closes. If a strategy executes trades during this formation period, it may act on signals that never truly existed in the final candle data.
There are two ways to ensure that we are trading on unchanged bar conditions:
- Use barstate.isconfirmed
- Use the bar index [1] technique
//@version=6
longCondition = rsi < 30  // oversold — illustrative long entry condition

if barstate.isconfirmed and longCondition
  strategy.entry("Long", strategy.long)
Using barstate.isconfirmed ensures that the script only evaluates the longCondition value after the candle has fully closed.
//@version=6
longCondition = rsi < 30  // oversold — illustrative long entry condition

if close[1] and longCondition
  strategy.entry("Long", strategy.long)
Similar to barstate.isConfirmed, using close[1] ensures that the script only evaluates the longCondition value after the candle has fully closed. Without this safeguard, strategies may behave very differently in live markets compared to backtests because intrabar fluctuations are not replicated perfectly in historical testing.
Rule 3: Disable Pyramiding Unless Intended
Pyramiding refers to opening multiple positions in the same direction. Pine Script v6's default for `pyramiding` is `0` (no pyramiding), but two things can still catch you out: older scripts may rely on older defaults, and the TradingView Strategy Tester's Properties tab can override the script-level setting — so a user running your script can enable pyramiding from the UI regardless of what the code says.
If pyramiding is allowed when it should not be, a strategy might open multiple trades during a single trend. For example, a breakout condition might remain true for several candles. Without restrictions, the strategy could enter multiple long positions during the same move. This multiplies profits artificially and produces unrealistic equity curves.
The defensive move is to set pyramiding explicitly in the `strategy()` call rather than relying on the default:
//@version=6
strategy(
  "My Strategy",
  pyramiding = 0
)
Most real-world traders operate with a single position at a time unless they are intentionally scaling into trades.
The belt-and-braces alternative: check before you enter
Because the Strategy Tester's Properties tab can override `pyramiding` from the UI, the most defensive pattern is to also guard the entry condition itself with an explicit check that no position is currently open. That way the strategy cannot open a second position even if pyramiding is switched on externally:
//@version=6
if longCondition and strategy.position_size == 0
  strategy.entry("Long", strategy.long)
The two approaches solve the same problem from different angles:
- `pyramiding = 0` in the `strategy()` call asks the engine to block additional positions.
- `strategy.position_size == 0` (or equivalently `strategy.opentrades == 0`) in the entry condition prevents the entry from even being submitted when a position is open.
Using both together means no UI override, no stale default, and no edge case in signal evaluation can produce an unintended second position. This is the pattern I use throughout the ORB book's strategies and it is worth making your default when building any single-position system.
This same defensive check also solves a different problem covered in Rule 5 below — a single sustained signal triggering repeatedly across consecutive bars — so implementing it here tends to pay off twice.
Rule 4: Always Account for Commission, Swap, and Slippage
Many strategies are backtested with zero transaction costs. This creates the illusion of perfect execution. In the real world, every trade incurs costs such as broker commissions, swaps, spreads, and slippage — particularly during volatile conditions.
Even small trading costs can dramatically affect strategy profitability.
//@version=6
strategy(
  "My Strategy",
  commission_type = strategy.commission.percent,
  commission_value = 0.01,   // example only — check your broker's spec for the real figure
  slippage = 1               // measured in mintick units (ticks), not points or dollars
)
Two units on `slippage` worth being explicit about: it is measured in mintick units, not points or dollars. For a US100 CFD quoted to 2 decimals, 1 tick = 0.01 points. For EURUSD quoted to 5 decimals, 1 tick = 0.00001. A blanket `slippage = 1` means something wildly different across instruments — pick a value that reflects the actual spread and fill friction on the symbol you are testing.
Consider a strategy targeting small profit margins such as scalping systems. If each trade aims to capture only a few points, trading costs can quickly eliminate any statistical edge. It's imperative that your expected trading costs are factored into the trading strategy. This is also why Strategy Order Types Explained matters: entry method and execution friction are tightly linked.
Swap is not in Pine's strategy settings
Pine Script does not model swap natively — there is no `swap_rate` parameter on `strategy()`. Folding overnight swap into `commission_value` overstates per-trade cost and hides the overnight timing that is what actually matters. If your strategy holds positions overnight, estimate swap drag separately:
- Record the swap long and swap short rates from the MT5 specification window (or your broker's contract spec).
- Count session rollovers between each trade's entry and exit bars in the backtest output.
- Subtract the expected swap drag from net P&L as a post-processing step, or reduce `initial_capital` in proportion to expected overnight exposure.
This matters particularly for swing traders holding through Wednesday night, when many brokers apply a triple-swap roll to cover the coming weekend. Not every broker charges the same amount, so always verify against your own.
For the specific values to plug into `commission_type`, `commission_value` and `slippage` — and how to read a broker's contract specification — see Matching Broker Constraints in TradingView Strategies. That guide walks through how to read the FTMO MT5 symbol window and translate it into honest Pine Script settings, and covers swap handling in detail.
Rule 5: Prevent Multiple Trades from the Same Signal
Another common issue occurs when strategies repeatedly trigger entries from a single signal. If a breakout condition remains true for multiple candles, the strategy may enter again on each bar.
//@version=6
if longCondition and strategy.opentrades == 0
  strategy.entry("Long", strategy.long)
This simple safeguard ensures that only one position is open at any time and prevents the strategy from artificially amplifying results through repeated entries.
Rule 6: Avoid Repainting Indicators
Repainting indicators are tools that modify historical signals after new data becomes available. Examples include ZigZag indicators, some divergence tools, and certain pivot calculations.
These indicators may appear extremely accurate historically because they adjust past signals using information that was not available at the time.
//@version=6
pivotHigh = ta.pivothigh(high, 3, 3)

if not na(pivotHigh)
  // pivot confirmed — safe to use
Ensuring signals only trigger after confirmation prevents strategies from relying on signals that would not have existed in real time. One nuance worth being explicit about: the value returned by `ta.pivothigh(high, 3, 3)` refers to the bar 3 candles ago — the lookforward period needed to confirm it. The strategy is therefore acting on a level that printed 3 bars before the current bar. That is correct and non-repainting, but if you size stops or targets from the pivot level, remember that price has had 3 bars to move away from it by the time the signal fires.
Rule 7: Use Realistic Position Sizing
Position sizing is a critical yet often overlooked element of backtesting. Many beginner strategies allocate the entire account balance to every trade. While this may produce impressive equity curves, it ignores the principles of risk management used by professional traders.
Most professional systems risk a fixed portion of capital per trade, often between 0.5% and 2%. For a deeper treatment of fixed-risk sizing, ATR-based stops, and expectancy, see Risk Management & Position Sizing and ATR Position Sizing.
//@version=6
riskAmount = 200   // dollars at risk per trade
pointValue = 1     // dollars per 1 point of price movement per 1.0 unit of position (instrument-specific)
stopDistance = math.abs(entryPrice - stopPrice)
positionSize = riskAmount / (stopDistance * pointValue)
The `pointValue` term is critical and instrument-specific. For a US-listed stock priced in dollars, one share moving one dollar is one dollar of P&L, so `pointValue = 1` is correct. For an index CFD like US100 with contract size = 1, one lot moving one point is also one dollar, so `pointValue = 1` again. For EURUSD a standard 1-lot position moving one pip (0.0001) is $10, which back-solves to a different `pointValue`. Gold, oil, and index futures each have their own contract specifications. Getting `pointValue` wrong by a factor of 10 or 100 is one of the most common sizing errors in ported backtests, so always verify against the instrument's contract spec.
This ensures that each trade risks a consistent and controlled amount of capital, allowing the strategy to survive losing streaks and maintain long-term stability.
Rule 8: Validate on Out-of-Sample Data
Rules 1–7 address execution integrity. Rule 8 addresses something equally dangerous: curve-fitting.
A strategy developed and optimised on a single data set will tend to overfit that data. The parameters are not capturing a genuine edge — they are capturing the noise in that specific history. The result looks impressive on paper and collapses the moment it encounters new data.
The solution is out-of-sample testing. Divide your historical data into two segments:
- In-sample period — use this to develop and tune the strategy
- Out-of-sample period — set this aside, touch nothing, and only evaluate results here after all decisions are finalised
If the strategy performs reasonably well on both periods, that is meaningful. If it excels on in-sample data but fails on out-of-sample data, the strategy is overfit regardless of how clean the equity curve looks.
A more rigorous version of this is walk-forward optimisation — rolling the in-sample and out-of-sample windows forward through time and checking that the strategy continues to perform on each new unseen period. Strategies that survive walk-forward testing have passed a much harder filter than a simple one-period backtest.
A strategy that was optimised on the same data it is evaluated on is not a backtest — it is a curve fit. Out-of-sample testing is the minimum bar for taking a strategy seriously. Walk-forward testing is the gold standard.
Rule 9: Test Across Multiple Instruments and Time Periods
A strategy backtested only on EURUSD from 2020 to 2023 has not been tested — it has been tailored. That period had specific volatility characteristics, specific trend behaviour, and specific macro conditions. A strategy that works only there is not proven; it is fitted to that environment.
Before treating any strategy as having a genuine edge, test it across:
- Multiple instruments in the same asset class (e.g., EURUSD and GBPUSD, or NAS100 and SPX500)
- Multiple market regimes — trending periods, ranging periods, high-volatility periods, low-volatility periods
- Multiple years — at minimum 2–3 years of meaningful data, more for lower-frequency strategies
If the strategy only works on one instrument in one era, the honest conclusion is that the edge has not been demonstrated. It may still be real, but the sample size is too narrow to know.
Specifically test against major market events
"Multiple market regimes" is too abstract a term to cover a major shock. The 2008 global financial crisis, the March 2020 COVID drawdown, the 2022 rate-hike cycle, Brexit, the January 2015 Swiss Franc peg break — these were not "volatility regimes" in the statistical sense. They were structural events that rewrote how markets behaved almost overnight. Most strategies never see one during development because the backtest window is too short, or the event sits in a period the developer quietly skipped as "anomalous".
The honest framing is this: you cannot predict when the next major market event will begin, when it will end, or which asset class will be at the centre of it. There is very little forward warning — often none — and by the time a name has been put to it, the move is already well underway. What you can do is verify that your strategy does not blow up across the events that have already happened. A strategy that survives the named historical shocks has earned a level of trust that a smooth-looking backtest over a calm period cannot match.
This is exactly why Why Backtesting Through Major Market Events Matters is a natural companion to this rule. That guide walks through how to explicitly include the 2008 GFC, the COVID crash, the 2022 rate shocks, and other named events in a backtest, and how to interpret what it means when your strategy behaves very differently through them. Resilience through those periods is a meaningfully stronger result than performance across a randomly chosen three-year window.
Rule 10: Stress-Test with Monte Carlo Simulation
Even a well-constructed backtest with out-of-sample validation is still a single path through history. The sequence of wins and losses you observed is just one possible ordering of those trades. A different ordering — which is equally possible — might produce a very different drawdown profile.
Monte Carlo simulation addresses this by randomly reshuffling the trade sequence hundreds or thousands of times and calculating the distribution of possible outcomes. This gives you a realistic range of:
- Maximum drawdown (not just the one that happened to occur in that order)
- Worst losing streak (based on probability, not just observed history)
- Probability of ruin at a given risk level
Most traders never run this. Those who do discover that their "acceptable" drawdown from the backtest often sits near the bottom of the probability distribution — meaning it was one of the better outcomes, not a representative one.
TradingView's Strategy Tester does not include a built-in Monte Carlo module, but the List of Trades can be exported and reshuffled in external tools such as Microsoft Excel or Python. Deep Backtesting is a paid-tier feature (Premium or higher) that gives a longer trade history, but free-tier users can still export the standard trade list from the regular Strategy Tester and run the same reshuffle. The output should inform your position sizing decisions, not just your entry logic.
Why These Rules Matter
When these ten principles are applied together, they dramatically improve the reliability of backtesting results. Strategies become more conservative but far more realistic. Instead of producing exaggerated performance metrics, they begin to reflect behaviour that could realistically occur in live trading.
Ignoring these rules can easily produce strategies that appear highly profitable but collapse immediately when deployed in real markets.
Conclusion
Backtesting should be treated as a scientific process rather than a simple experiment. Reliable strategies require careful attention to data integrity, execution assumptions, and risk management.
By following the ten rules outlined in this article you ensure that your TradingView strategies:
- Do not use future market data
- Execute trades only on confirmed signals
- Include realistic trading costs
- Avoid artificial profit amplification
- Manage risk responsibly
- Are validated on data they were not tuned on
- Hold up across multiple instruments and market regimes
- Have been stress-tested for the drawdowns that could plausibly occur
These principles form the foundation of professional strategy development and provide confidence that your backtests reflect reality rather than an illusion of profitability. Once those structural basics are in place, the next layer is regime testing in Why Backtesting Through Major Market Events Matters.