What's Inside a TradingView Strategy Tester Export
A walkthrough of every section of TradingView's Strategy Tester .xlsx export — what each tab contains, what each metric means, and what you can do with the data.
Only paid TradingView plans (Plus, Premium, Ultimate) can export the Strategy Tester results to a spreadsheet. If you're on the free tier, you might not realise what you're missing — or how much richer the export is than the on-screen Strategy Tester. This guide walks through every section of the export, explains the metrics, and shows what kind of analysis becomes possible once you have the file.
TradingView's Strategy Tester is one of the easiest ways for retail traders to backtest an idea. You write a strategy in Pine Script, point it at a chart, and a panel pops up with performance metrics, an equity curve, and a list of trades.
What most people don't realise is that the panel only shows you a fraction of what TradingView actually computes. The full picture lives in the .xlsx export — and that export is only available on paid TradingView plans (Plus, Premium, or Ultimate).
This guide walks through every section of the export so that:
- If you're on the free tier, you'll know exactly what's hidden behind the paywall, and whether it's worth upgrading for what you want to do.
- If you're on a paid tier, you'll know what each tab and column actually means, and what kinds of questions the export can answer that the on-screen panel can't.
You need a paid TradingView plan to export. The Excel export button on the Strategy Tester is only available on Plus, Premium, or Ultimate. The free tier shows the same data on screen, but cannot export to .xlsx.
How to export (paid tiers)
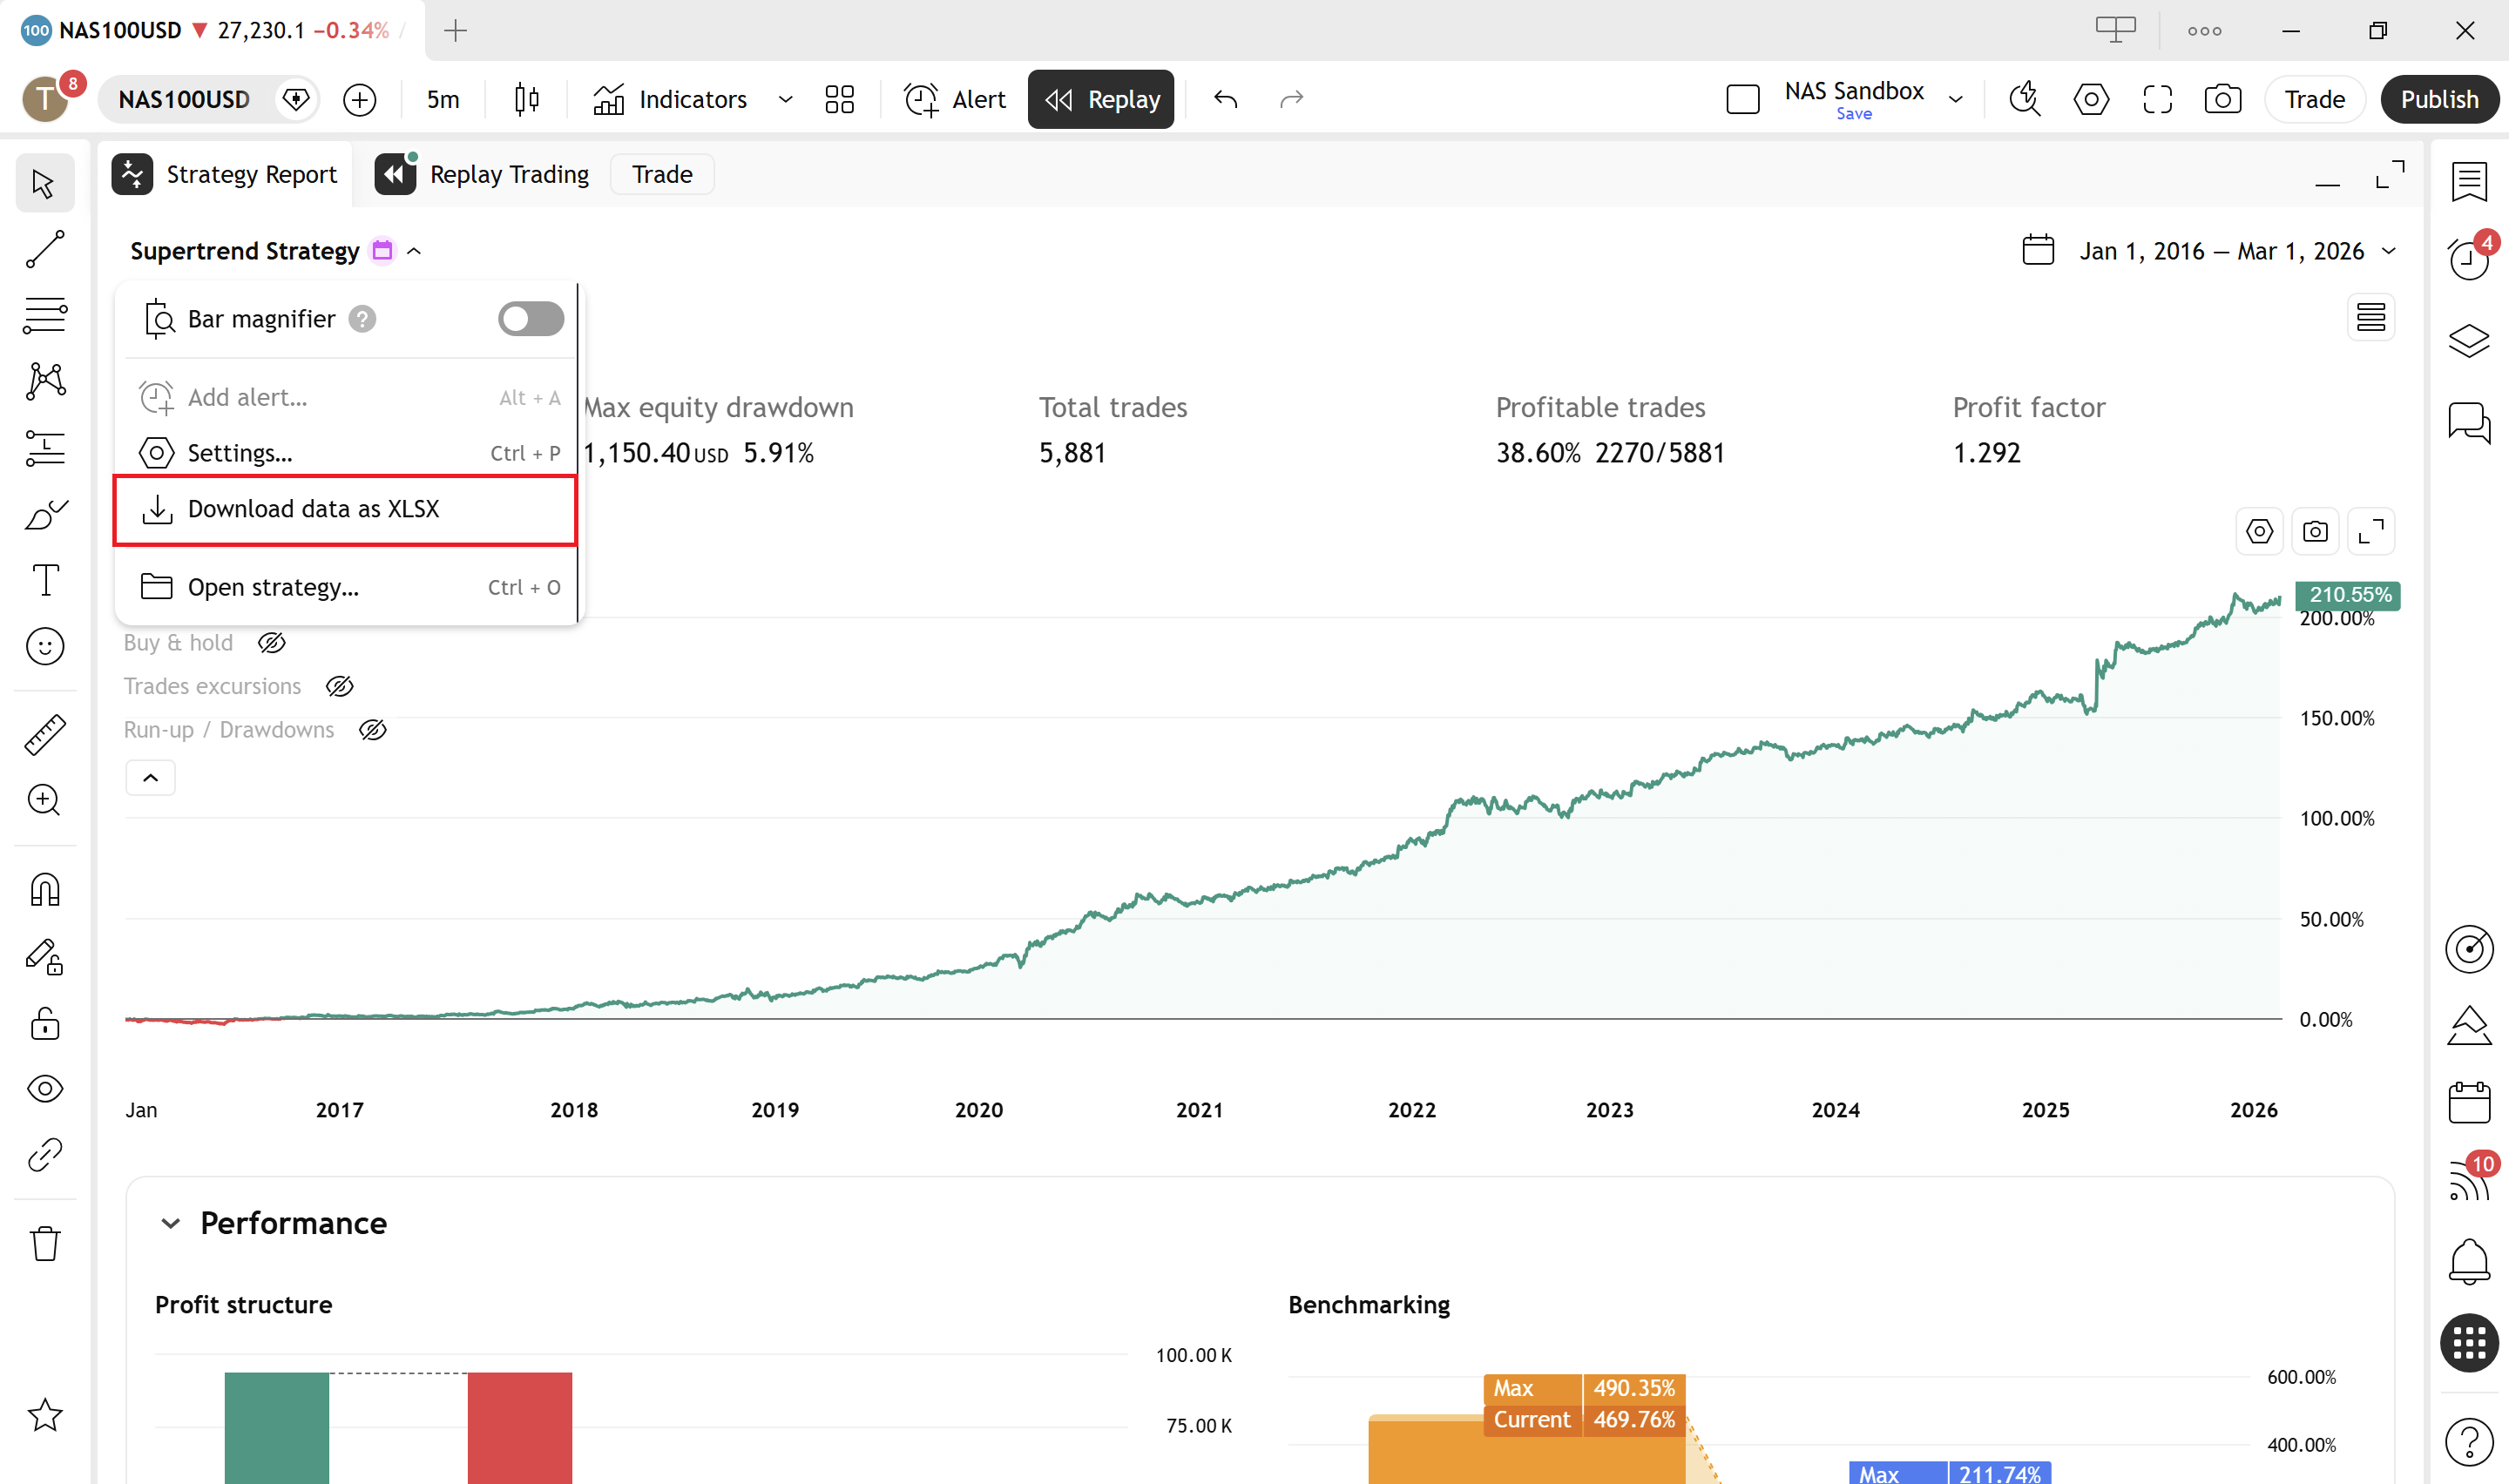
Open the Strategy Tester panel at the bottom of the chart, run a backtest, and look for the download / export icon in the top-right of the panel. Pick the .xlsx option (TradingView also offers CSV for individual sections, but the .xlsx is the only one that bundles everything together).
You'll get a single workbook named after the strategy and the symbol — for example `OANDA NAS100USD, 5 - Supertrend Strategy.xlsx`. Open it in Excel, Numbers, or Google Sheets. Every tab you see in the on-screen Strategy Tester corresponds to a sheet inside the workbook, plus a couple of extras.
A tour of the workbook
The export is a single .xlsx file with five sheets. Each one covers a different angle on the same backtest.
1. Performance Summary
The headline metrics. This is what most traders think is the backtest — net profit, gross profit, gross loss, profit factor, max drawdown, win rate, ratio of avg win to avg loss, total trades, average trade, largest winning/losing trade, and so on. You'll usually see three columns: All trades, Long trades, and Short trades — useful for spotting whether the edge is one-sided.
Two metrics here are easy to misread:
- Profit Factor is gross profit / gross loss. Anything above 1.0 is profitable on paper, but a profit factor built on 12 trades over 5 years tells you nothing.
- Max Drawdown here is reported as a single peak-to-trough number. The real distribution of drawdowns lives in the equity curve and the list of trades — not on this sheet.
2. List of Trades
Every trade the strategy took, in chronological order. Each trade has at least two rows: one Entry and one Exit (and more if you have multi-leg exits or partials). Columns include trade number, type (Entry long / Exit long / Entry short / Exit short), date/time, signal name, price, position size, profit in absolute and percent terms, and cumulative profit running down the column.
This is the most valuable sheet in the export. The on-screen panel shows you trades as a list you can scroll, but it's painful to analyse. Once it's in a spreadsheet you can:
- sort by P&L to find the trades that carried the strategy,
- filter by year, month, or session to see when it actually worked,
- pull the cumulative-profit column out as an equity curve,
- compute things the on-screen panel doesn't, like average hold time, Sharpe, or returns by day-of-week.
3. Trade Analysis
Per-trade statistics that go beyond simple P&L: MAE (Maximum Adverse Excursion) and MFE (Maximum Favourable Excursion) — how far each trade went against you before it worked, and how much it left on the table before exit. Also includes run-up and drawdown per trade.
This is the sheet that tells you whether your stops are too tight, your targets are too greedy, or whether you have any signal worth optimising at all. If your winners routinely show large MAE before turning profitable, that's a clue — your entries are early. If your losers show large MFE before reversing, your exits are late.
4. Risk Performance Ratios
The risk-adjusted metrics: Sharpe ratio, Sortino ratio, and a few related figures. These are useful as comparison points between strategies, less useful in isolation. A 0.8 Sharpe doesn't mean much without something to compare it against.
5. Properties
A snapshot of the strategy's configuration at the time of the backtest: symbol, timeframe, date range, initial capital, base currency, order size, pyramiding, commission model, slippage, and every input parameter the script exposes. This is the receipt for the run — six months later when you wonder "what settings did I use for this?", this is where you find out.
What the export shows that the on-screen panel doesn't
It's tempting to think the export is just "the on-screen panel as a spreadsheet." It isn't. The export gives you four things the panel can't:
- Trade-by-trade granularity as data. You can sort, filter, and pivot every trade. The on-screen list is read-only and capped at what fits on the screen.
- MAE and MFE per trade. These aren't shown anywhere on the on-screen panel — they only exist in the export.
- The equity curve as a series, not a chart. The cumulative profit column in List of Trades gives you the equity curve as numbers, so you can compute monthly returns, rolling drawdown, or returns distribution.
- Settings preserved alongside the results. The Properties sheet means six months later you don't have to remember which parameters you used — they're in the file.
Download a sample export
The sample below is the actual .xlsx export from a real backtest — a Supertrend Strategy on OANDA:NAS100USD at the 5-minute timeframe. Open it and poke around at every tab covered above:
If you want to understand the strategy that produced this export — why it trades when it trades, and where its weaknesses are — the Supertrend Strategy page walks through the rules, the filter logic, and the reasoning behind each choice. The numbers in the spreadsheet make a lot more sense once you've read it.
What you can do with the data
Once you've got the export, the real value is in feeding it into deeper analysis — equity curve studies, prop firm rule simulation, multi-strategy portfolio scenarios, and so on. Doing this by hand in Excel works the first time, but it gets repetitive fast: every time you tweak a strategy and re-export, you're back to rebuilding the same pivot tables and the same charts.