Stochastic Oscillator
A range-relative momentum oscillator comparing the closing price to the recent high-low range, useful for pullback and mean-reversion entries.
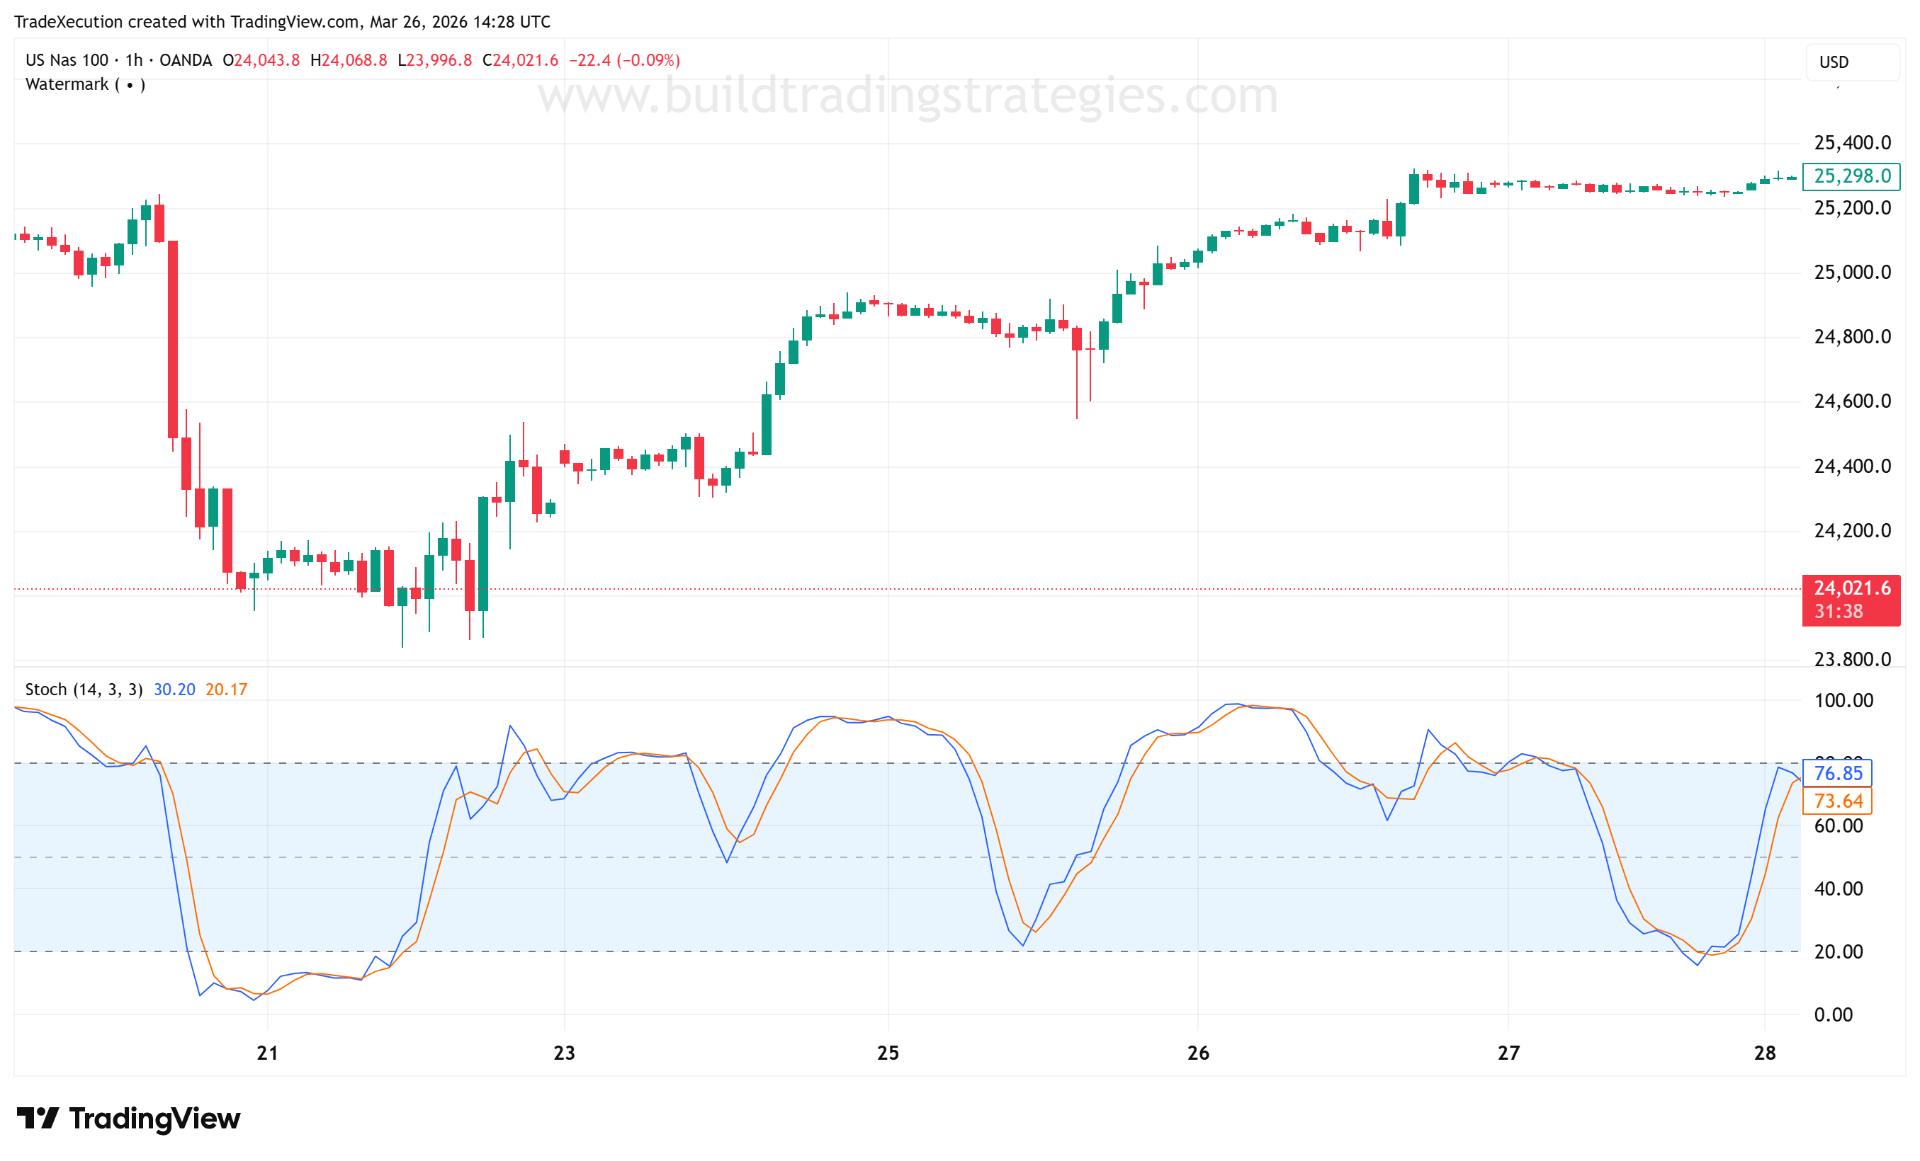
The stochastic oscillator was developed by George Lane in the late 1950s. It compares the current closing price to the recent high-low range. It is a momentum oscillator, but it is range-relative rather than average-gain/loss based like RSI. Traders often focus on 80/20 zones and on crossovers between %K and %D.
The formula
``` %K = 100 × (Close − Low_N) / (High_N − Low_N) %D = M-period SMA of %K ```
Where `Low_N` and `High_N` are the lowest low and highest high over the past N bars. The conventional `(14, 3, 3)` parameter set means: `N = 14` (lookback), `%K smoothing = 3` (a 3-period SMA of the raw %K, producing the 'slow %K' most charts display), and `%D smoothing = 3` (a 3-period SMA of that smoothed %K).
How to read it
`%K` is the faster line; `%D` is the slower signal line. Above 80 is conventionally 'overbought'; below 20 is 'oversold'. Note that Stochastic's 80/20 thresholds are wider than RSI's 70/30 — Stochastic spends more time pinned at extremes because it is a pure range-relative measure, so the wider thresholds prevent excess signal frequency. A %K cross up through %D in oversold territory is a classic long signal; the reverse for shorts.
Stochastics are especially helpful in range-bound or slower-moving markets, where repeated swings from one side of a range to the other matter more than long trend persistence. In strategy terms, that makes them a natural fit for pullback entries and mean-reversion systems. They are less reliable when used on their own during strong trends, because "oversold" in an uptrend may simply mean "pullback in progress," not "time to short the market."
Stochastic vs RSI
Both are bounded momentum oscillators, but they measure different things. RSI tracks the ratio of average up-closes to average down-closes — it measures directional conviction. Stochastic tracks where price sits within its recent range — it measures position. The practical consequence: RSI is more informative in trending moves (it shows whether the trend's up-closes are intensifying or fading); Stochastic is more informative in ranges (it shows whether price is near the top or bottom of its recent box). Many systematic traders use both, with RSI for trend/momentum context and Stochastic for pullback timing.