OBV (On-Balance Volume)
A cumulative volume indicator that adds volume on up closes and subtracts on down closes, used for confirming breakouts and trend strength.
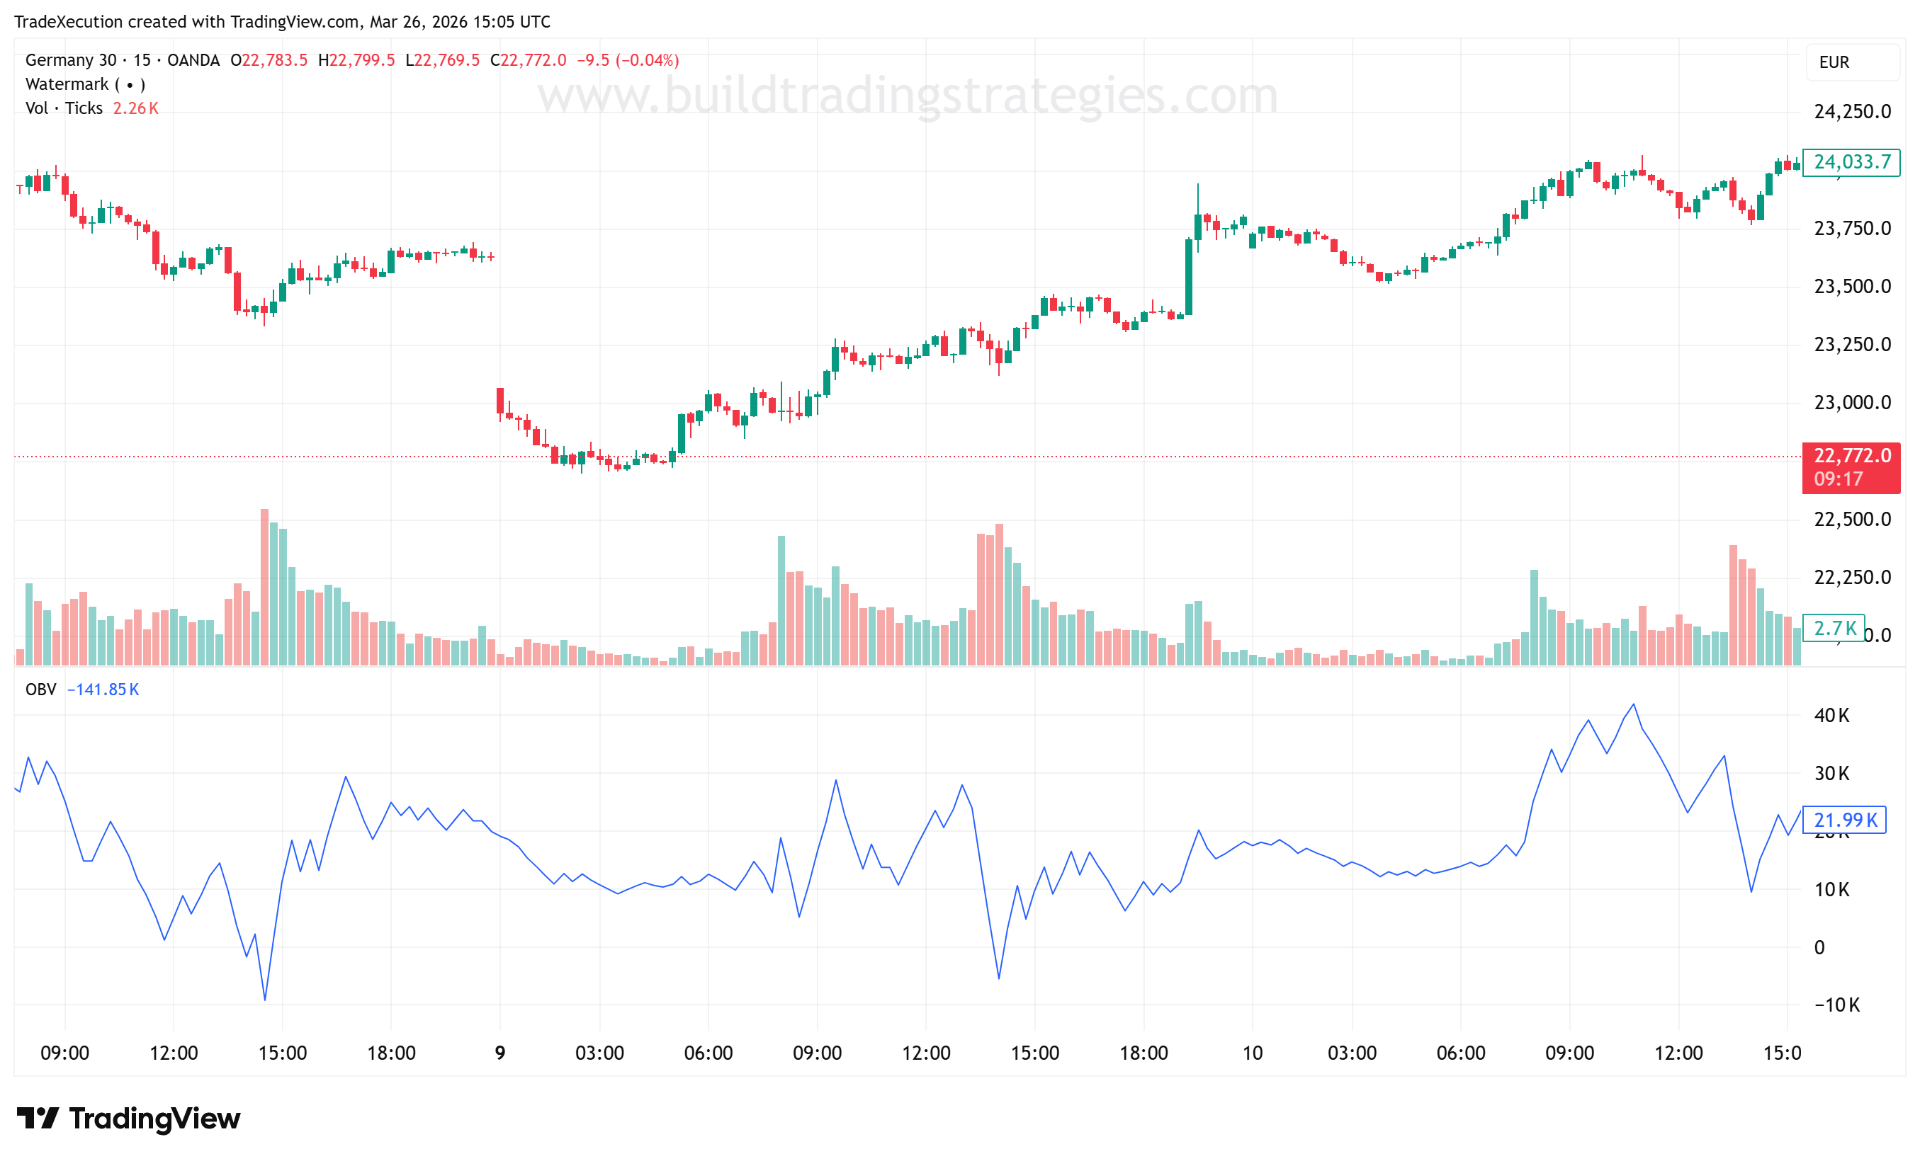
OBV is a running cumulative total of volume: add the full bar's volume when the close is higher than the previous close, subtract it when the close is lower. The absolute value of OBV is arbitrary and meaningless — it depends on where the chart history starts. What matters is the direction and slope of the line relative to price.
Rising OBV while price rises means volume is supporting the move. Falling OBV while price rises means the move is happening on declining participation — a warning sign.
How traders use it
### Breakout confirmation Price breaks above a resistance level — does OBV simultaneously break above its own resistance? A price breakout with OBV also making a new high is more reliable than one where OBV is flat or falling. Volume is participation; a breakout without participation is suspect.
### Trend confirmation In a healthy uptrend, OBV should be making higher highs alongside price. If price makes a new high but OBV doesn't, the new high is being made on lower volume than the previous high — a classic divergence warning.
### Divergence OBV divergence works the same way as RSI divergence: price makes a new extreme, OBV doesn't follow. This doesn't guarantee a reversal but does indicate the move is weakening internally. Use it as a filter or exit signal, not a standalone entry.
### Smoothing Raw OBV is noisy. Adding a 20-period EMA to OBV smooths the signal and makes the slope clearer. When OBV is above its own EMA, volume is net supportive; below, it's net negative.
//@version=6
indicator("OBV Demo", overlay=false)

obvValue   = ta.obv
obvEma     = ta.ema(obvValue, 20)
bullishOBV = obvValue > obvEma   // OBV above its own average = net supportive

plot(obvValue, "OBV",     color=bullishOBV ? color.green : color.red, linewidth=2)
plot(obvEma,   "OBV EMA", color=color.orange, linewidth=1)

hline(0, color=color.gray, linestyle=hline.style_dotted)

bgcolor(bullishOBV ? color.new(color.green, 95) : color.new(color.red, 95))
Key takeaway: OBV is a confirmation tool, not a primary signal. A price breakout with OBV simultaneously making a new high is meaningfully more reliable than one with flat or declining OBV. A breakout where OBV is diverging — or where volume was thin on the breakout bar — is worth scrutinising before committing. OBV doesn't give you entries; it tells you whether entries generated by other signals are supported by participation.
Related volume indicators
OBV is the simplest and oldest of the cumulative volume indicators, but several alternatives refine the idea:
- Chaikin Money Flow (CMF) uses the position of the close within each bar's high–low range to weight volume (close near the high ⇒ positive volume; close near the low ⇒ negative). More nuanced than OBV's binary up-close/down-close rule.
- Accumulation/Distribution Line (ADL) is the same core idea as CMF but cumulative like OBV.
- Money Flow Index (MFI) applies the RSI formula to volume-weighted price — a bounded 0–100 oscillator that is sometimes called "volume-weighted RSI".
- Volume Rate of Change (VROC) tracks how fast volume itself is accelerating, independent of price direction.
If OBV's divergence signals feel too noisy, CMF or ADL usually produce cleaner readings because they weight each bar by how decisively the close finished rather than just in which direction.